

- Wondering if PPL is a hidden value opportunity or just fairly priced? Let’s dig into what’s really driving the stock’s numbers and whether now is the right time to look closer.
- PPL’s share price has climbed 13.5% so far this year, with a 19.4% gain over the last 12 months, even after a recent 2.2% drop in the past week. This suggests a blend of optimism and caution among investors.
- Recent market sentiment has picked up after PPL announced updates on several infrastructure projects, including expansions to their clean energy initiatives. The company’s push into renewables has caught the attention of analysts and investors alike, adding more context to the recent price movements.
- Despite this momentum, PPL currently scores 0 out of 6 on our valuation checks, meaning not a single key indicator points to undervaluation. Let’s break down the standard ways to assess a stock’s value and stick around, because the most insightful valuation approach is coming up at the end.
PPL scores just 0/6 on our valuation checks. See what other red flags we found in the full valuation breakdown.
Approach 1: PPL Discounted Cash Flow (DCF) Analysis
The Discounted Cash Flow (DCF) model estimates what a company is worth today, based on projections of how much cash it will generate in the future. These expected cash flows are projected out over several years and then brought back to present value using a discount rate. This helps investors assess whether the current price makes sense.
For PPL, the current Free Cash Flow is negative at $-353 Million, reflecting recent investment or operating challenges. According to analyst expectations, PPL’s Free Cash Flow is forecast to reach $1.49 Billion by 2028. Looking further ahead, projections estimate Free Cash Flow moderating to around $751 Million by 2034, based in part on analyst input and extended by financial models.
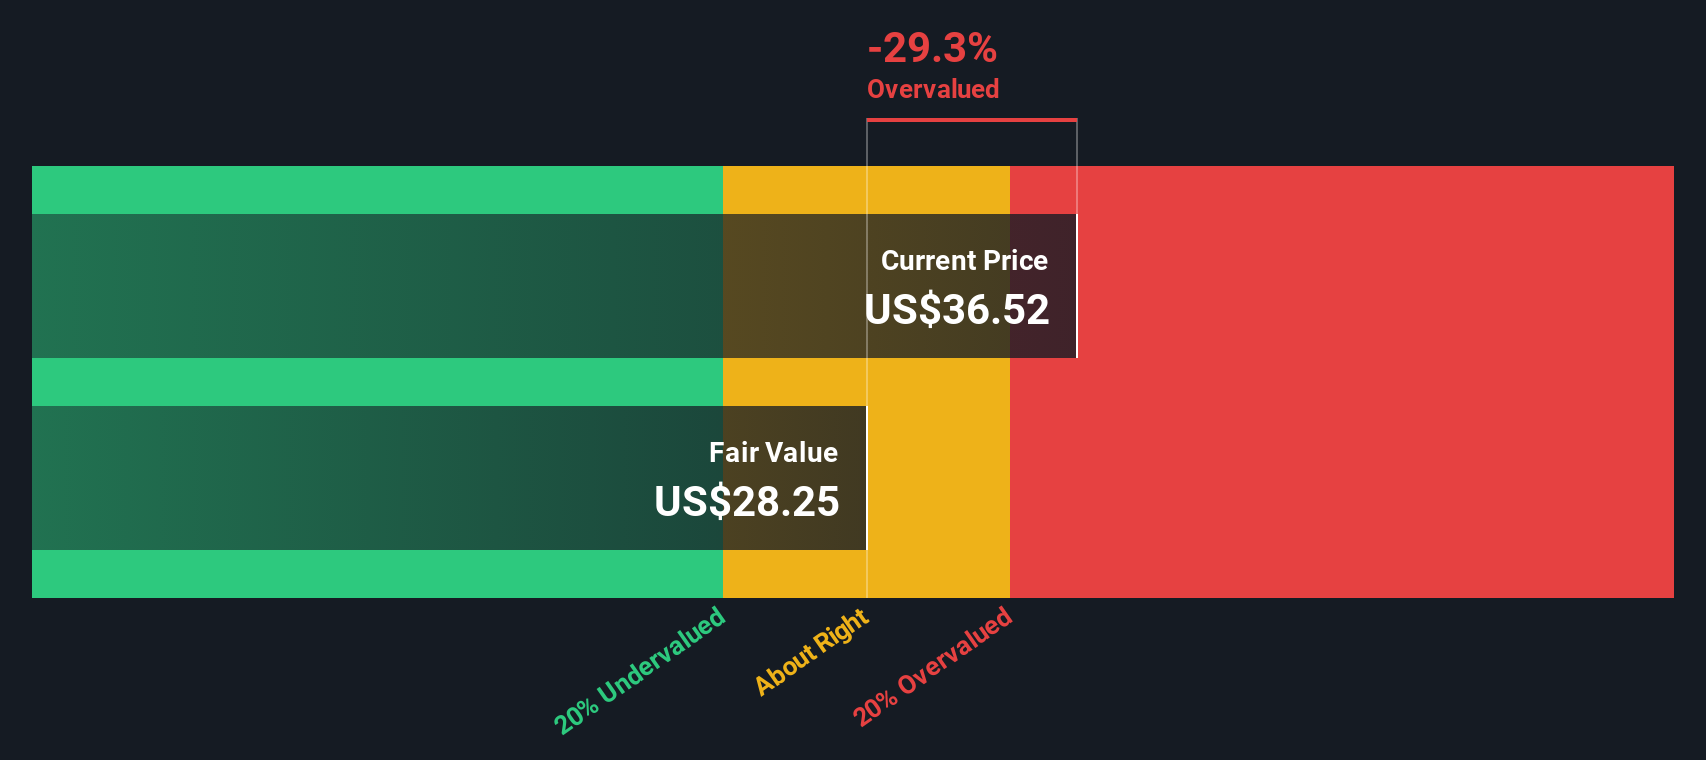
Using this two-stage DCF approach, the estimated intrinsic value of PPL shares is $28.25. Compared to the actual share price, this indicates the stock is approximately 29.3% overvalued according to these calculations. In other words, the current market price is running well ahead of what the long-term cash flows suggest is fair value for the stock.
Result: OVERVALUED
Our Discounted Cash Flow (DCF) analysis suggests PPL may be overvalued by 29.3%. Discover 831 undervalued stocks or create your own screener to find better value opportunities.
 PPL Discounted Cash Flow as at Nov 2025
Approach 2: PPL Price vs Earnings (P/E Ratio)
The Price-to-Earnings (P/E) ratio is a time-tested way to gauge valuation for profitable companies. It reflects how much investors are willing to pay for each dollar of earnings, making it especially relevant for established businesses with consistent profits, like PPL.
Determining what is considered a “normal” or “fair” P/E ratio for a company typically depends on expectations for future growth and the risks facing the business. Higher expected earnings growth or lower risk warrants a higher P/E, while slower growth or higher risks justify a lower multiple. Industry benchmarks and peer comparisons can offer some context, but they do not always account for a company’s unique characteristics.
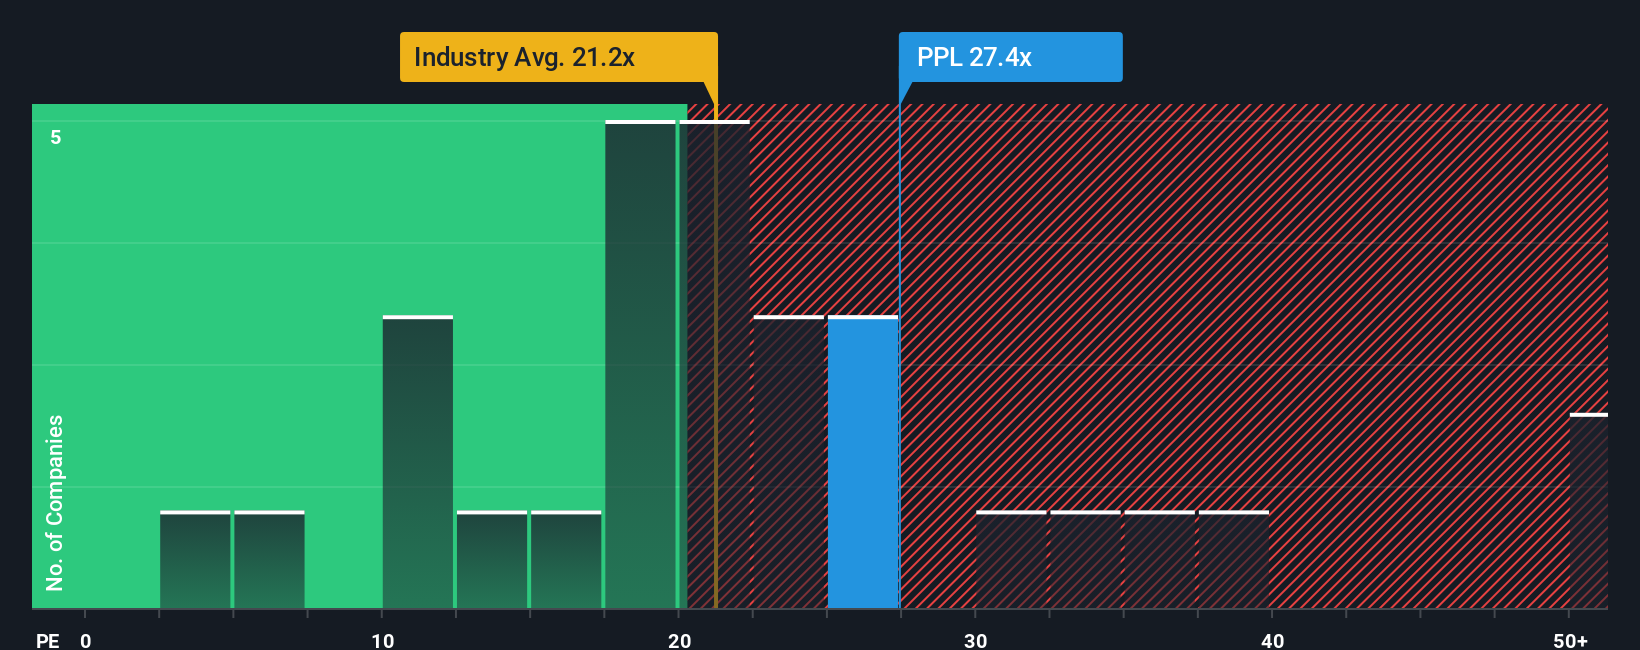
PPL currently trades on a P/E of 27.4x. That is noticeably higher than both the electric utilities industry average of 21.2x and the peer average of 18.1x. On the surface, this premium might suggest the stock is expensive relative to its sector and competitors.
However, Simply Wall St’s proprietary “Fair Ratio” method goes a step further by factoring in not just industry norms, but also PPL’s specific traits such as its earnings growth, risk profile, profit margins, and overall size. This tailored approach produces a Fair P/E Ratio of 23.7x for PPL, which represents a balanced price given its idiosyncratic strengths and challenges.
Comparing PPL’s actual P/E of 27.4x to the Fair Ratio of 23.7x, the stock trades above what would be expected based on all relevant factors. This suggests the market is pricing PPL at a premium beyond its fundamentals.
Result: OVERVALUED
 NYSE:PPL PE Ratio as at Nov 2025
PE ratios tell one story, but what if the real opportunity lies elsewhere? Discover 1410 companies where insiders are betting big on explosive growth.
Upgrade Your Decision Making: Choose your PPL Narrative
Earlier we mentioned that there’s an even better way to understand valuation, so let’s introduce you to Narratives. A Narrative is simply the story or perspective you have about a company’s future. It connects your unique view on PPL’s growth, profitability, and risks to a concrete financial forecast, and then to an estimated fair value for the stock.
With Narratives, you’re not just reacting to yesterday’s numbers. Instead, you anchor your investment decisions in the scenario you actually believe is most likely. Available on Simply Wall St’s Community page, Narratives is an accessible tool used by millions of investors to map out their own assumptions, such as how much revenue PPL will make or how strong its margins will be, and instantly see what those beliefs mean for fair value compared to the current share price.
What sets Narratives apart is that it updates dynamically as new earnings releases, news, or analyst forecasts come in, helping you quickly assess whether your investment case is still on track or needs a rethink. For example, some PPL investors currently set a bullish fair value as high as $42 per share, expecting rapid revenue and margin growth from major grid upgrades. Others are more cautious, pegging fair value closer to $34 if they foresee slower demand or tougher regulation. Narratives let you easily test and visualize these perspectives for yourself.
Do you think there’s more to the story for PPL? Head over to our Community to see what others are saying!
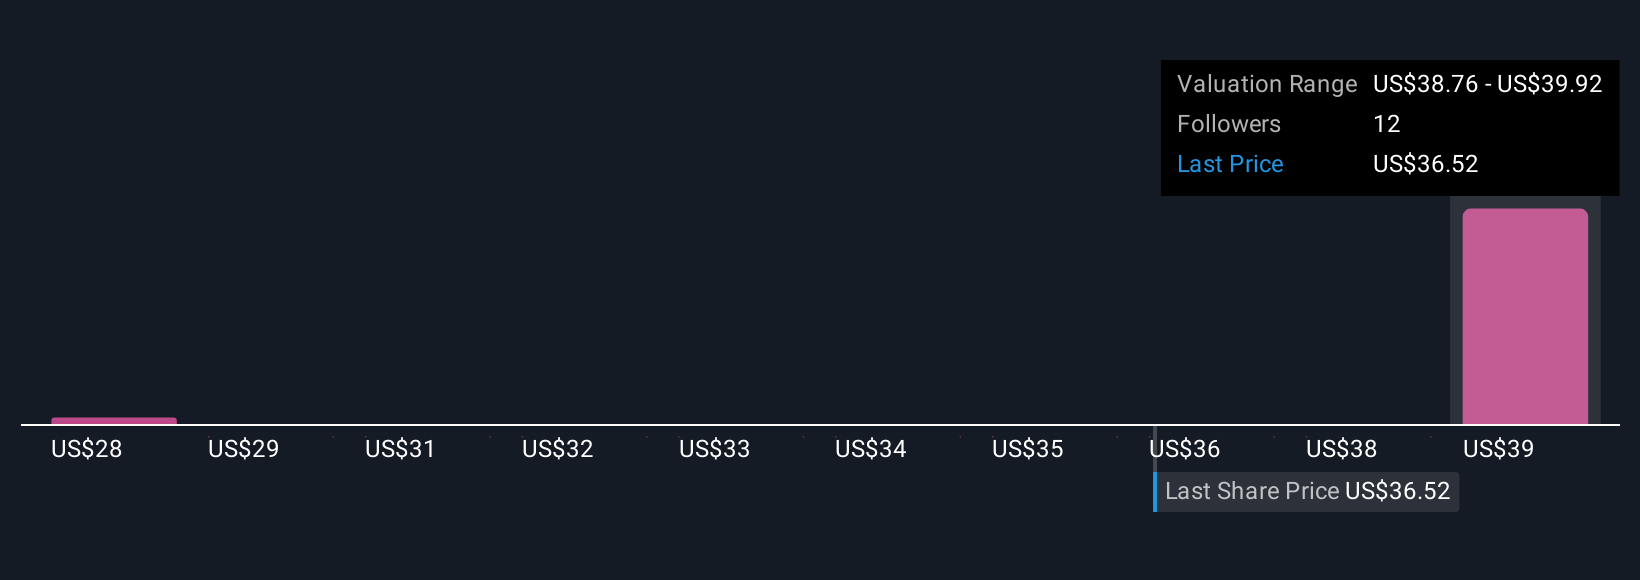 NYSE:PPL Community Fair Values as at Nov 2025
This article by Simply Wall St is general in nature. We provide commentary based on historical data
and analyst forecasts only using an unbiased methodology and our articles are not intended to be financial advice. It does not constitute a recommendation to buy or sell any stock, and does not take account of your objectives, or your
financial situation. We aim to bring you long-term focused analysis driven by fundamental data.
Note that our analysis may not factor in the latest price-sensitive company announcements or qualitative material.
Simply Wall St has no position in any stocks mentioned.
We’ve created the ultimate portfolio companion for stock investors, and it’s free.
• Connect an unlimited number of Portfolios and see your total in one currency
• Be alerted to new Warning Signs or Risks via email or mobile
• Track the Fair Value of your stocks
Have feedback on this article? Concerned about the content? Get in touch with us directly. Alternatively, email editorial-team@simplywallst.com