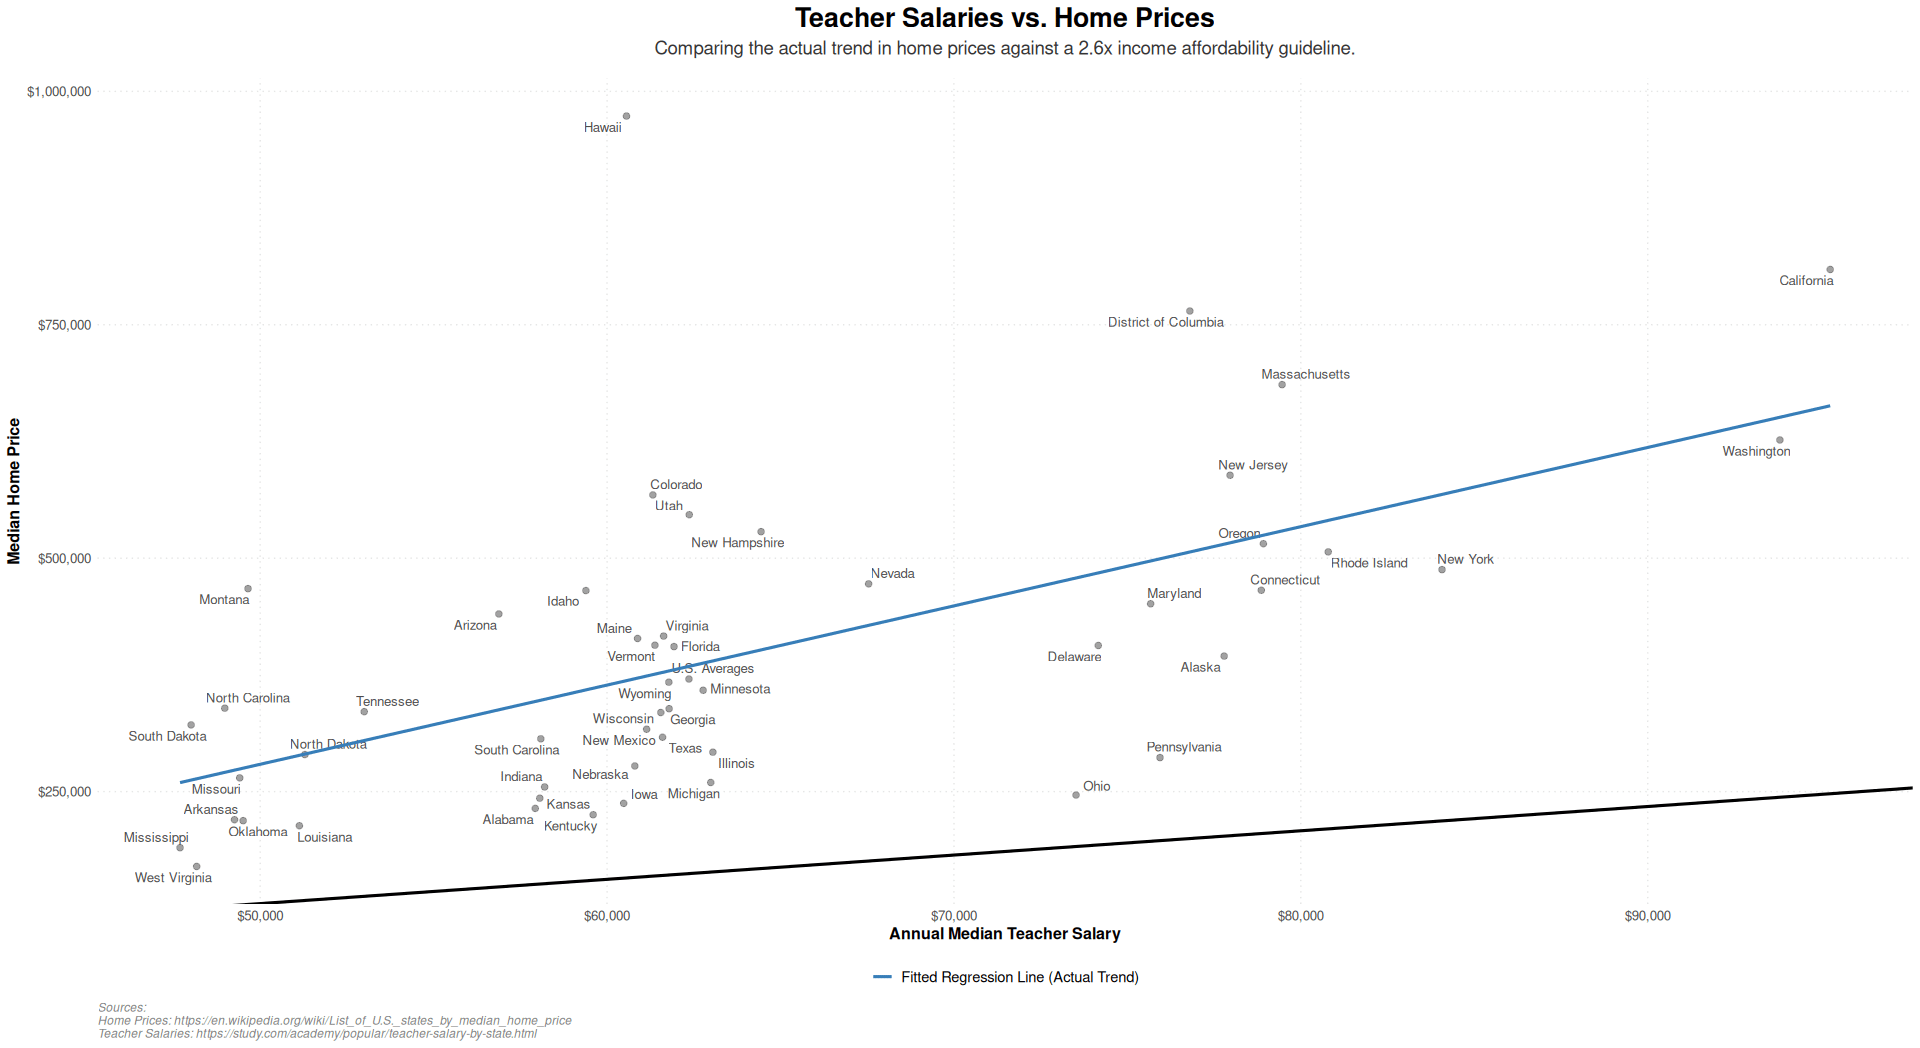
What is the black line? 2.6x salary? bc it looks off
gbac16 on
I am a teacher and in 2004, I bought my house for around $120k. I made $37k in my fourth year, and had zero to put down and zero in savings. The lender approved me for up to $275k. That’s when I knew something was wrong. And then the housing crisis happened. Luckily I was savvy enough to not borrow that whole amount.
Momoselfie on
Almost didn’t even notice Hawaii way out there.
ymi17 on
So being *under* the line is good in this case? (For the teacher)
perldawg on
without your title telling me what i’m supposed to conclude, this graph wouldn’t mean much to me. i wouldn’t really understand the relationship between the 2 lines, it would just look like a scatter plot of home prices and teacher salaries by state with a black line across the bottom
RossUtse on
Just like in reality, Hawaii is off by itself. That price 😨
jacobb11 on
How about a bar graph with the house/salary ratio on the y axis and the states on the x axis lowest to highest?
That would make it easier to compare states and easier to determine which states are below whatever ratio one deems “affordable.
negative-nelly on
States are way way too big of a category for this to mean anything.
StandnIntheFire on
If the salary was calculated based on a single teacher’s income, I would say that any single person has a tough time affording a house.
Kekelsauce on
Doesn’t really matter what job you have.
Housing is mostly unaffordable, overinflated, and waiting to pop.
ChameleonCoder117 on
While being below the blue line is good, a lot of the places below the blue line generally suck to live in.
Missouri, Mississippi, West Virginia, Arkansal, Oklahoma, Louisiana, Alabama, Kentucky, Kansas, Indiana, South Carolina, Nebraska, Iowa, Texas, New Mexico, and Wyoming all suck to live in.
I’d count Delaware, Conneticut, and Rhode island in the “sucks to live in and also below the line” category, but i honestly have no clue what it’s like there. For me those states are only known because they’re small, and Ohio is just….. Weird.
For the places below the line that are nice to live in:
Michigan, Wisconsin, Minnesota, Ohio?, Pennsylvania, Maryland, Alaska, New York, Oregon, Alaska, and Washington.
Meanwhile a lot of places above the line are good to live in, like:
Hawaii(if you can afford it), Maine, Vermont, Florida(kind of), Virginia, New Jersey, DC, Massachusetts, California, New hampshire, Nevada(maybe), Colorado, and Utah.
DomonicTortetti on
What am I even looking at…you’re charting home price (something you don’t pay the full price of all at once) vs. teacher salary? And doing it on a scatterplot with the most dubious fitted regression line? I’m sorry, this is next to useless.
Teachers make approximately the median wage in the US. They aren’t anywhere close to the lowest paid profession, where ostensibly this kind of chart would make more sense? Although I would suggest just throwing this chart in the dumpster.
Charming-Border7429 on
One of my daughters and her husband are music teachers in Minnesota. Realistically, you can bump the salary up by about another 50%. She teaches private lessons in the evenings, and he runs the district summer music program and supervises the marching band.

![[OC] How (Un)affordale homes are on teacher salaries in U.S. states](https://www.byteseu.com/wp-content/uploads/2025/11/3j08qrgzxwyf1-1536x838.png "[OC] How (Un)affordale homes are on teacher salaries in U.S. states")
14 Comments
Sources are listed in the image; they are:
for home prices:https://en.wikipedia.org/wiki/List_of_U.S._states_by_median_home_price
for teacher salaries: https://study.com/academy/popular/teacher-salary-by-state.html
This was done using R.
What is the black line? 2.6x salary? bc it looks off
I am a teacher and in 2004, I bought my house for around $120k. I made $37k in my fourth year, and had zero to put down and zero in savings. The lender approved me for up to $275k. That’s when I knew something was wrong. And then the housing crisis happened. Luckily I was savvy enough to not borrow that whole amount.
Almost didn’t even notice Hawaii way out there.
So being *under* the line is good in this case? (For the teacher)
without your title telling me what i’m supposed to conclude, this graph wouldn’t mean much to me. i wouldn’t really understand the relationship between the 2 lines, it would just look like a scatter plot of home prices and teacher salaries by state with a black line across the bottom
Just like in reality, Hawaii is off by itself. That price 😨
How about a bar graph with the house/salary ratio on the y axis and the states on the x axis lowest to highest?
That would make it easier to compare states and easier to determine which states are below whatever ratio one deems “affordable.
States are way way too big of a category for this to mean anything.
If the salary was calculated based on a single teacher’s income, I would say that any single person has a tough time affording a house.
Doesn’t really matter what job you have.
Housing is mostly unaffordable, overinflated, and waiting to pop.
While being below the blue line is good, a lot of the places below the blue line generally suck to live in.
Missouri, Mississippi, West Virginia, Arkansal, Oklahoma, Louisiana, Alabama, Kentucky, Kansas, Indiana, South Carolina, Nebraska, Iowa, Texas, New Mexico, and Wyoming all suck to live in.
I’d count Delaware, Conneticut, and Rhode island in the “sucks to live in and also below the line” category, but i honestly have no clue what it’s like there. For me those states are only known because they’re small, and Ohio is just….. Weird.
For the places below the line that are nice to live in:
Michigan, Wisconsin, Minnesota, Ohio?, Pennsylvania, Maryland, Alaska, New York, Oregon, Alaska, and Washington.
Meanwhile a lot of places above the line are good to live in, like:
Hawaii(if you can afford it), Maine, Vermont, Florida(kind of), Virginia, New Jersey, DC, Massachusetts, California, New hampshire, Nevada(maybe), Colorado, and Utah.
What am I even looking at…you’re charting home price (something you don’t pay the full price of all at once) vs. teacher salary? And doing it on a scatterplot with the most dubious fitted regression line? I’m sorry, this is next to useless.
Teachers make approximately the median wage in the US. They aren’t anywhere close to the lowest paid profession, where ostensibly this kind of chart would make more sense? Although I would suggest just throwing this chart in the dumpster.
One of my daughters and her husband are music teachers in Minnesota. Realistically, you can bump the salary up by about another 50%. She teaches private lessons in the evenings, and he runs the district summer music program and supervises the marching band.