
![The Last 100 Years of Solar Eclipses in One Image [OC]](https://www.byteseu.com/wp-content/uploads/2025/11/c4l6qngzqp0g1-1536x1097.png "The Last 100 Years of Solar Eclipses in One Image [OC]")
edit: This map includes annular eclipses and the scale for colors is bad. Better version in the comments plus a bonus future eclipse map
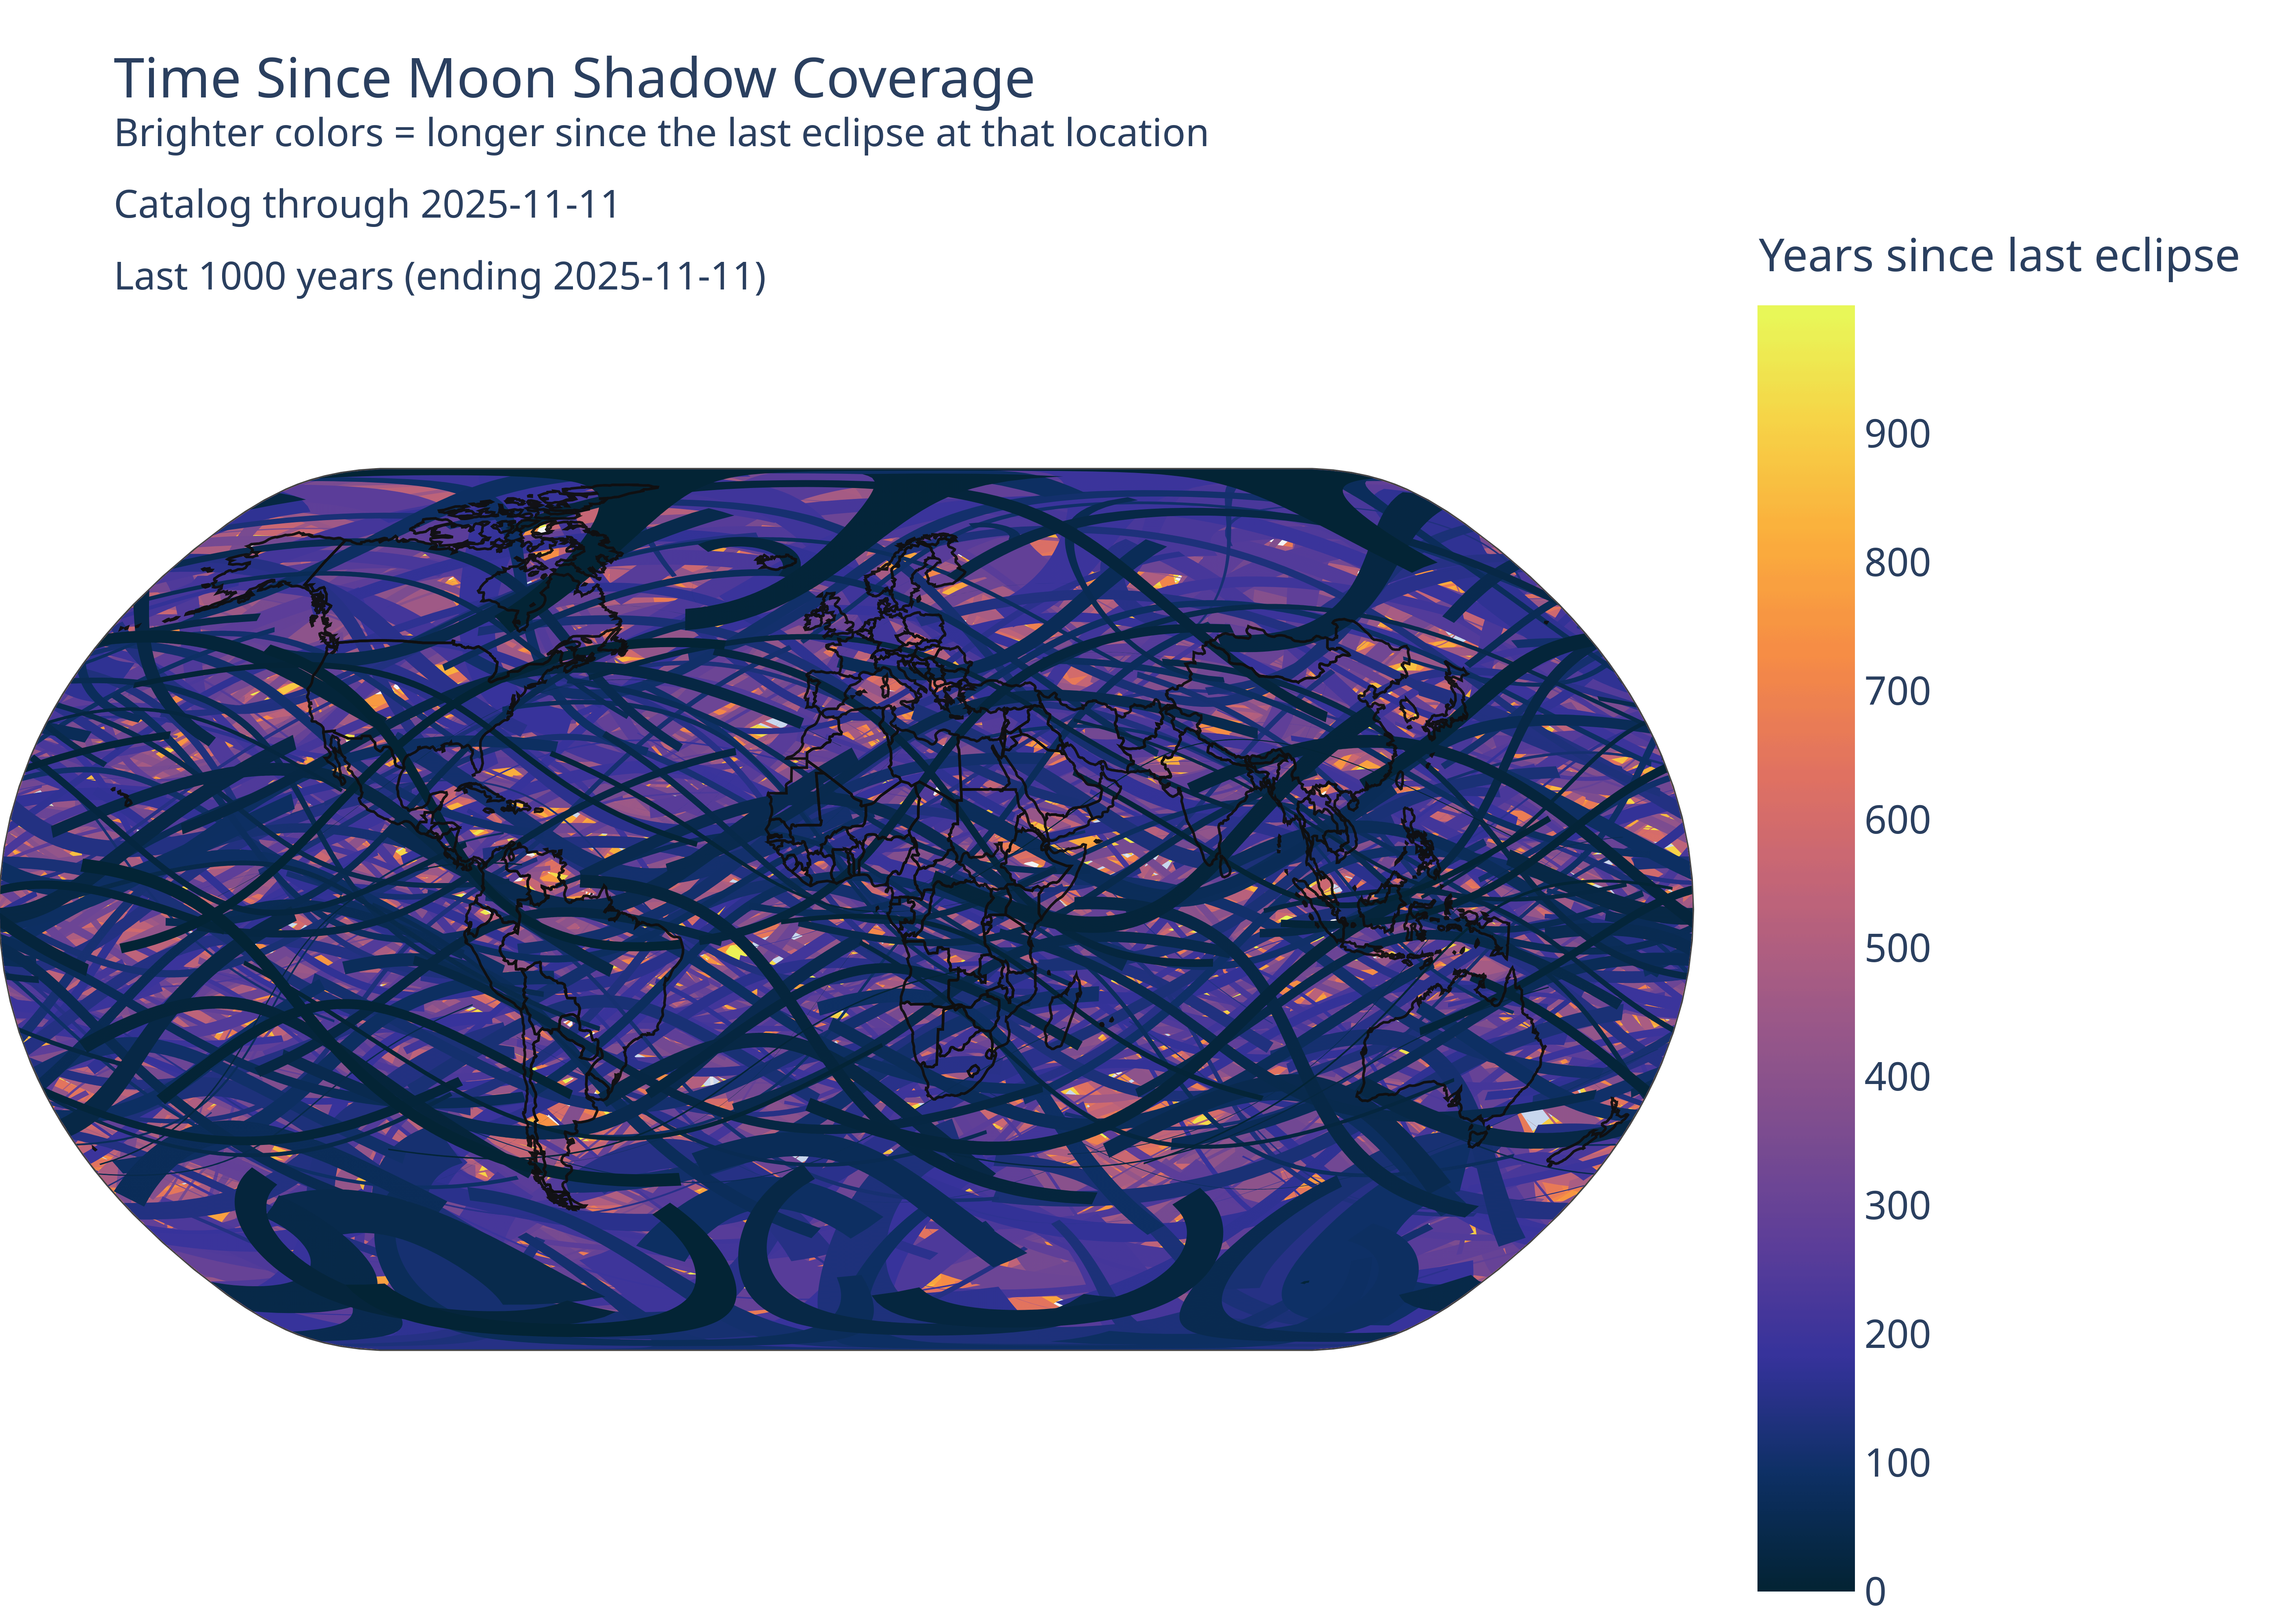
Every solar eclipse from the last 1,000 years, layered so that the most recent coverage wins. I sampled 512 points per path and rendered the entire history to capture the weave of shadow tracks across the continents.
Posted by LayAnEgg
17 Comments
Sources:
Data: NASA’s Besselian elements catalog ([https://eclipse.gsfc.nasa.gov/5MCSE/5MCSEcatalog.txt](https://eclipse.gsfc.nasa.gov/5MCSE/5MCSEcatalog.txt))
Tools: Python + Plotly/Kaleido (https://github.com/GregFiegel/eclipse-mapping)
I was right in the path of the 2017 Eclipse. And so was a cloud, during totality. Chances are, it would be more than a 1000 years before that opportunity comes again. Specifically, my living in an area that just happens to have totality.
Wow what are the chances of an eclipse following the borders of every country!?
Piece of advice – with the range of devices people are going to be viewing your plot on, it’s very difficult to tell the values apart because most of the plot is quite dark. It would be much easier to visually interpret the differences in values if you either reverse the palette or choose a different colour scale.
It looks to me like the data set starts at yellow for 1000, and yet there are clearly white areas within the map. Are these areas which have not experienced a solar eclipse in the past millennia?
Seems pretty random
I’d expected something like a Spirograph
Daaaaamn. We dark outchea in Massachusetts…
that one point in the center that is over 900 years — let them have it already
https://preview.redd.it/q22ss8qukq0g1.png?width=2800&format=png&auto=webp&s=5ad6ee778c740d839d921272d651ec1e6cee5ca1
Looks a lot better now
Okay I misinterpreted that. I thought that somehow the Mike Oldfield song “Moonlight Shadow” is covered by other artists so frequently that you can make this beautiful diagram out of it.
Oh there was a mapamundi inside … Why black?
Would be interesting to see a heat map version to see what areas get shadowed the most
Why is there a gaping void in the place of… USSR…? and NK
Your Minecraft camera noclips and you see the caves.
Having the continents outlined in black was not the play.
Russia is completely gone from the map. Not that I mind actually.
This is so non intuitive which makes it great.