
![The Disappearance of the Mid-Range Jumper: NBA Shot Density from 2004–2024 (Top 300 Tiles per Season) [OC]](https://www.byteseu.com/wp-content/uploads/2025/11/3kg7c73wbr0g1-878x1024.gif "The Disappearance of the Mid-Range Jumper: NBA Shot Density from 2004–2024 (Top 300 Tiles per Season) [OC]")
Built in R using dplyr, ggplot2, ggfx, ragg, and gifski.
Data from NBA, compiled for ease of use by Dominic Samangy. Available at https://github.com/DomSamangy/NBA_Shots_04_25
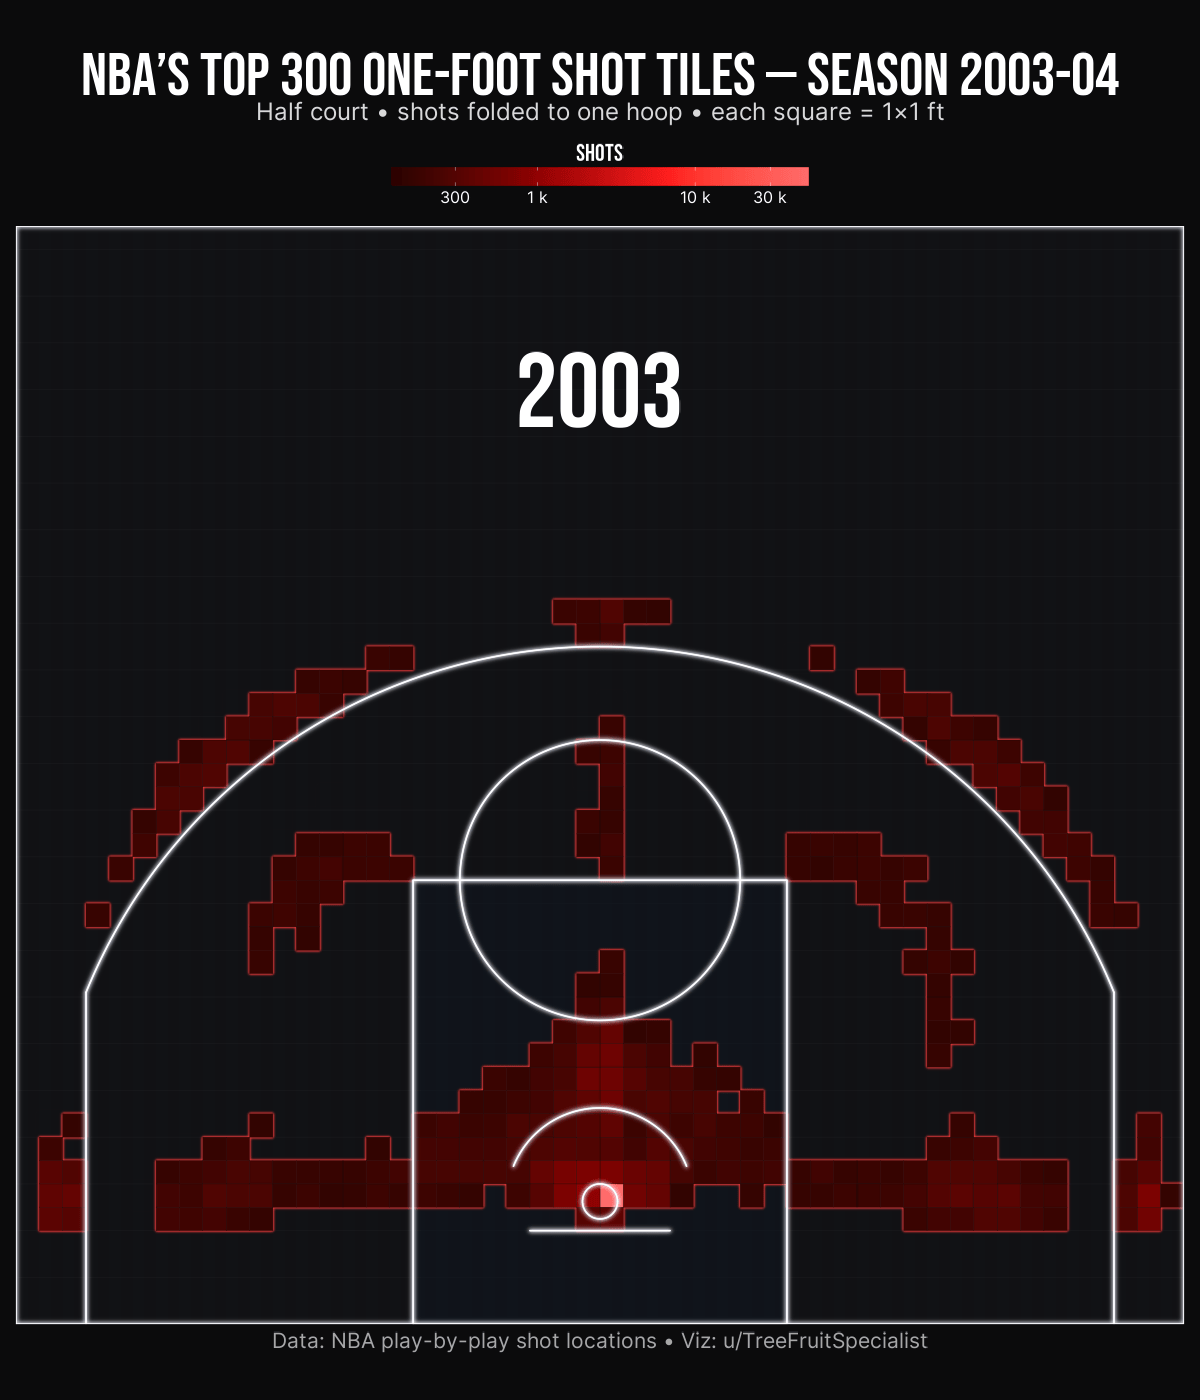
Based on 4,443,714 NBA play-by-play shot attempts, each frame shows one season folded onto a single half court and binned into 1×1-foot tiles. Color intensity represents the log-scaled number of shots from each spot.
Across two decades, the mid-range slowly evaporates, leaving only two islands of efficiency: the paint and the three-point line.
Posted by TreeFruitSpecialist
3 Comments
I don’t know much about basketball, why is this?
This is visually appealing. The three pointer rules all now.
Damn. I’ve seen this for 20-30 tiles and that felt shocking. This is utterly insane even though I knew it would look like this.