
![[OC] Number of children born to parent age pairs in the US in 2024](https://www.byteseu.com/wp-content/uploads/2025/11/v5puc14t251g1-1536x1025.png "[OC] Number of children born to parent age pairs in the US in 2024")
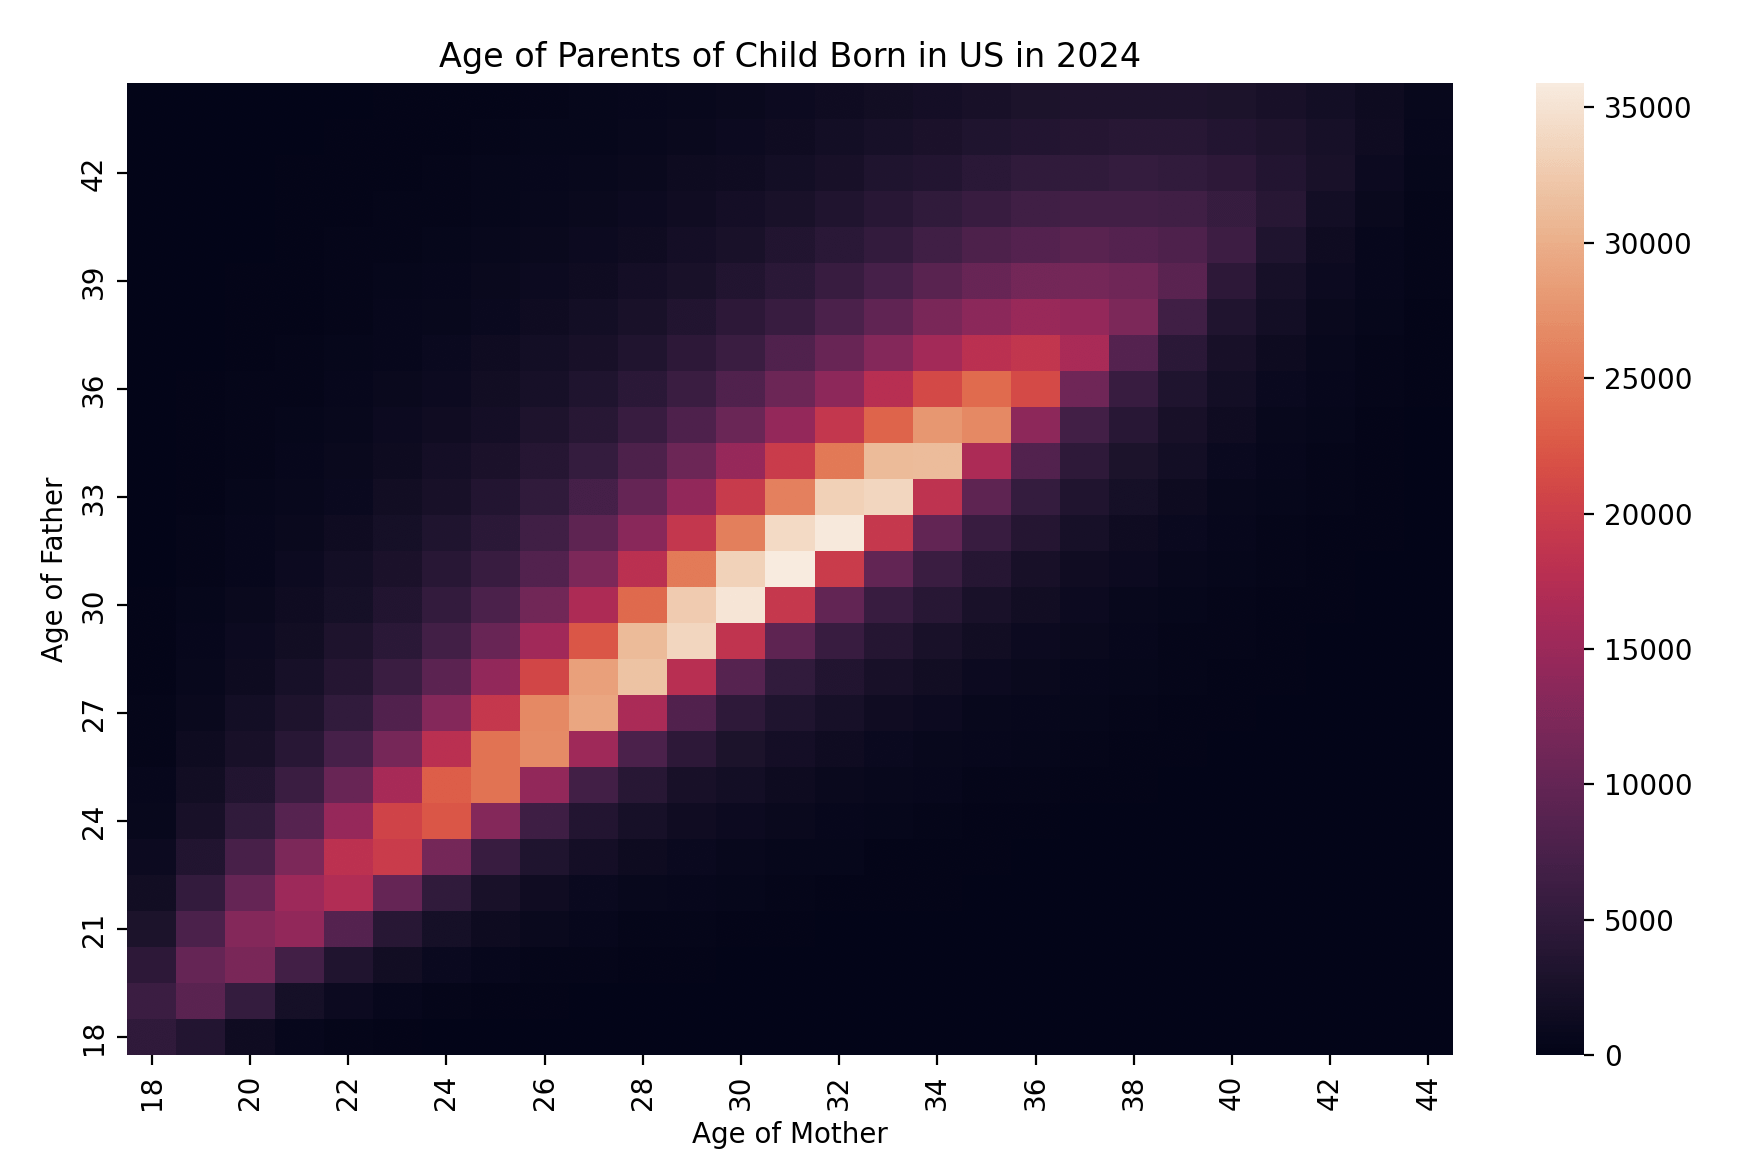
I made this plot using Matplotlib and the data from the US CDC vital statistics data which is publicly available here: https://www.cdc.gov/nchs/data_access/Vitalstatsonline.htm . The data is on the over 3.5 million births of children in the US in 2024.
The x-axis is the mother's age, while the y-axis is the father's age. The color depicts the number of births with that age pairing as depicted by the scale on the right. I find it very interesting how parents are so close in age, I guess I thought there would there would be more older man/younger women pairing with a more significant age gap (10+ years) but it turns out that's relatively rare.
Posted by lorisaurus
10 Comments
would be interesting to see on a log scale imo
Shitty colors. Can’t easily differentiate 5000 from 0
Wow, we are deep in that really dark zone. It looks like men are generally slightly older, but not a great deal older, while women rarely have children with men that are much younger than themselves. The diffusion in the older group is also interesting.
This would make a cool quilt pattern
I don’t know what I’m looking at. It makes for a pretty cool picture, but the outliers are seemingly completely hidden by the darkness.
It would be really neat to see an animation of how this changes year to year. (IDK if that data even would exist though). I would expect the brightness to slowly creep up and right over the years, but curious if other trends would stand out.
My wife was 27 and I 26 when we just had our first.
Looks like a pixelated galaxy
I bet this would go from cool to cruel real fast if we expanded those axes down past 18
surely there were fathers older than 45
made more sense if you normalized each cell by the total number of couples with that age pair, so colors would show number of children per say 1000 couple of that age pair.
When you plot just total numbers, it is not clear whether brighter cells are because same age couples are having more children or that we just have more same age couples in the population.