
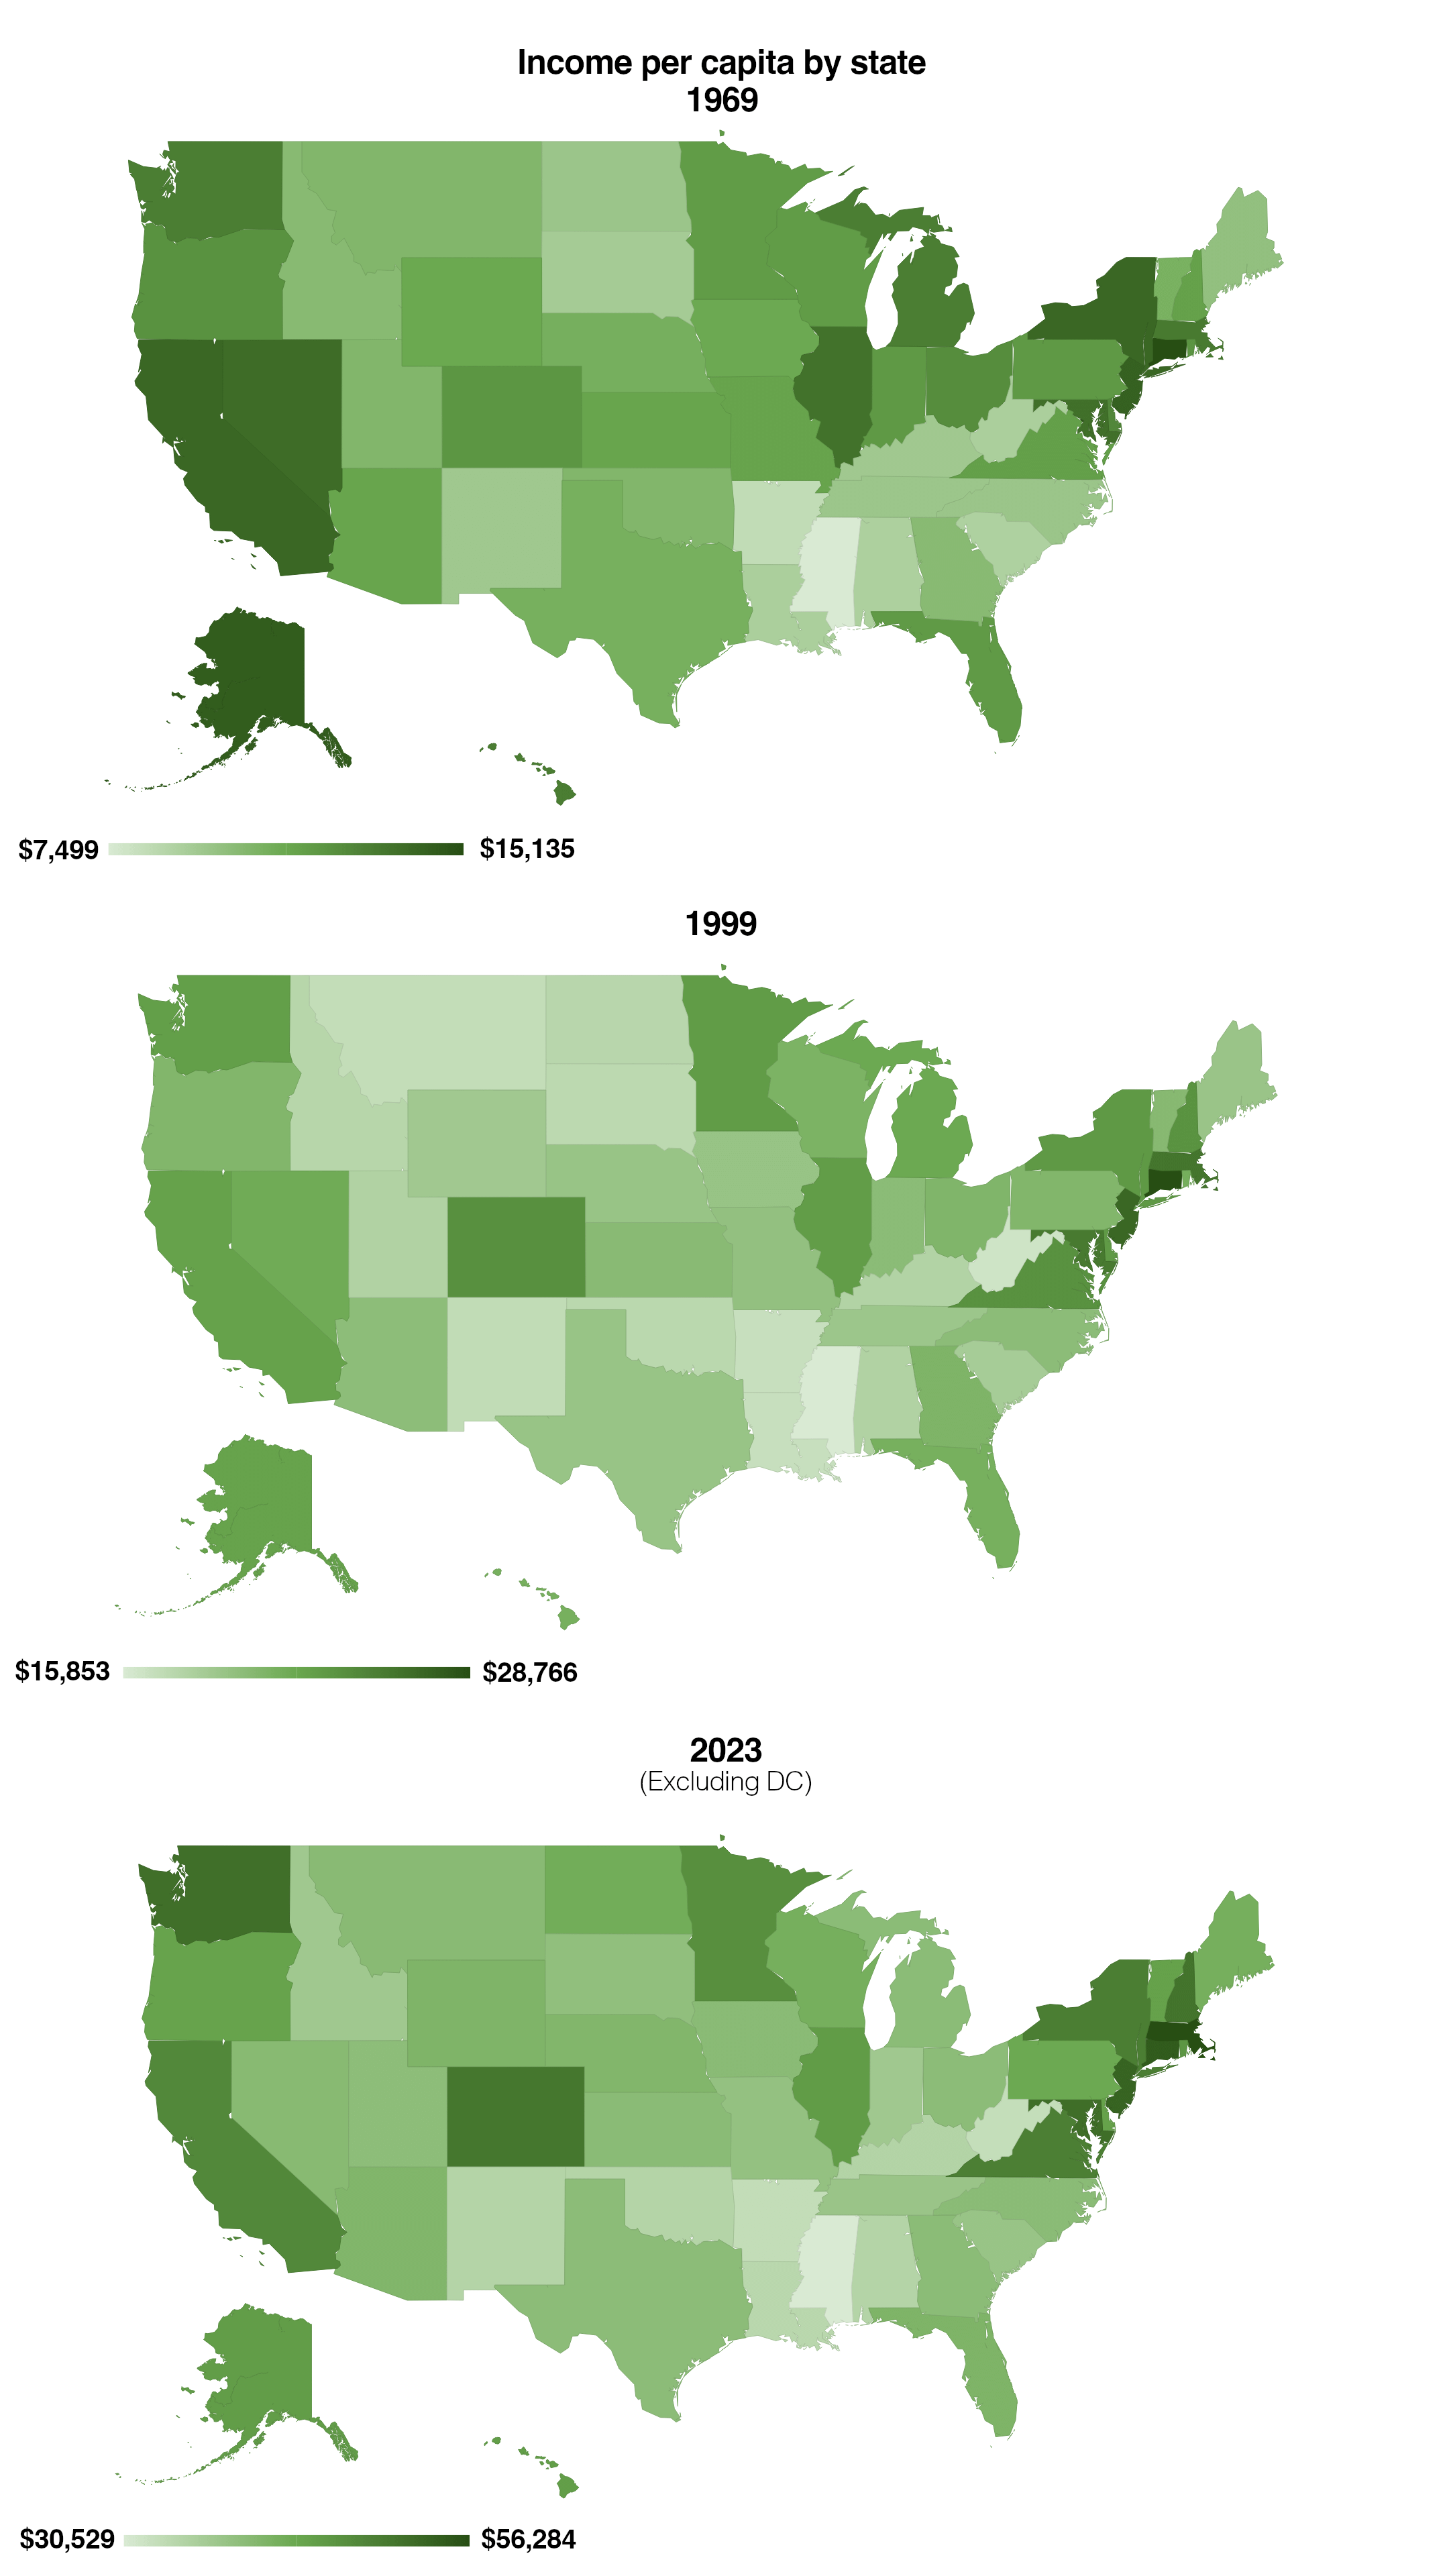
![[OC] Per Capita Income by State from 1969, 1999, and 2023](https://www.byteseu.com/wp-content/uploads/2025/11/1prin0xg9c1g1-864x1536.png "[OC] Per Capita Income by State from 1969, 1999, and 2023")
Data: https://pmc.ncbi.nlm.nih.gov/articles/PMC2621124/ and https://worldpopulationreview.com/state-rankings/per-capita-income-by-state
Tools: Google Sheets (geo chart), GIMP
I excluded Washington, DC from the 2023 map because it is such an outlier ($75,253 per capita) that it left little contrast between the rest of the states
Posted by previousinnovation
13 Comments
Poor little Mississippi, nothing ever changes.
Interesting that New York appears to have decreased then increased. Any thoughts as to why?
[deleted]
Michigan is very accurate considering Detroit and the automobile industry.
Mississippi and West Virginia doing their part to make sure the rest of us are eternally in the top 48
Adjusted for cost of living, surely? Right? Right?
how was Nevada so high in 1969? AFAIK it has never been particularly wealthy.
I like this because it’s a long timeframe and because my state got steadily darker.
Each year has its own scale, represented by the same color gradients, making it impossible to actually see any trend between the three years.
Is the income adjusted for inflation?
Due to migration from California and surrounding states, Texas will become the richest state in the south and inland states in the coming years
Ah, poor Michigan. Losing the auto industry hit hard.
Also, what’s up with Colorado?
What is happening at Massachusetts?
It would be easier to understand if the dollars were anchored to a certain year