
![Snow on the ground in the Netherlands (1975–2024) [OC]](https://www.byteseu.com/wp-content/uploads/2025/11/9walg81xiz1g1-1536x864.png "Snow on the ground in the Netherlands (1975–2024) [OC]")
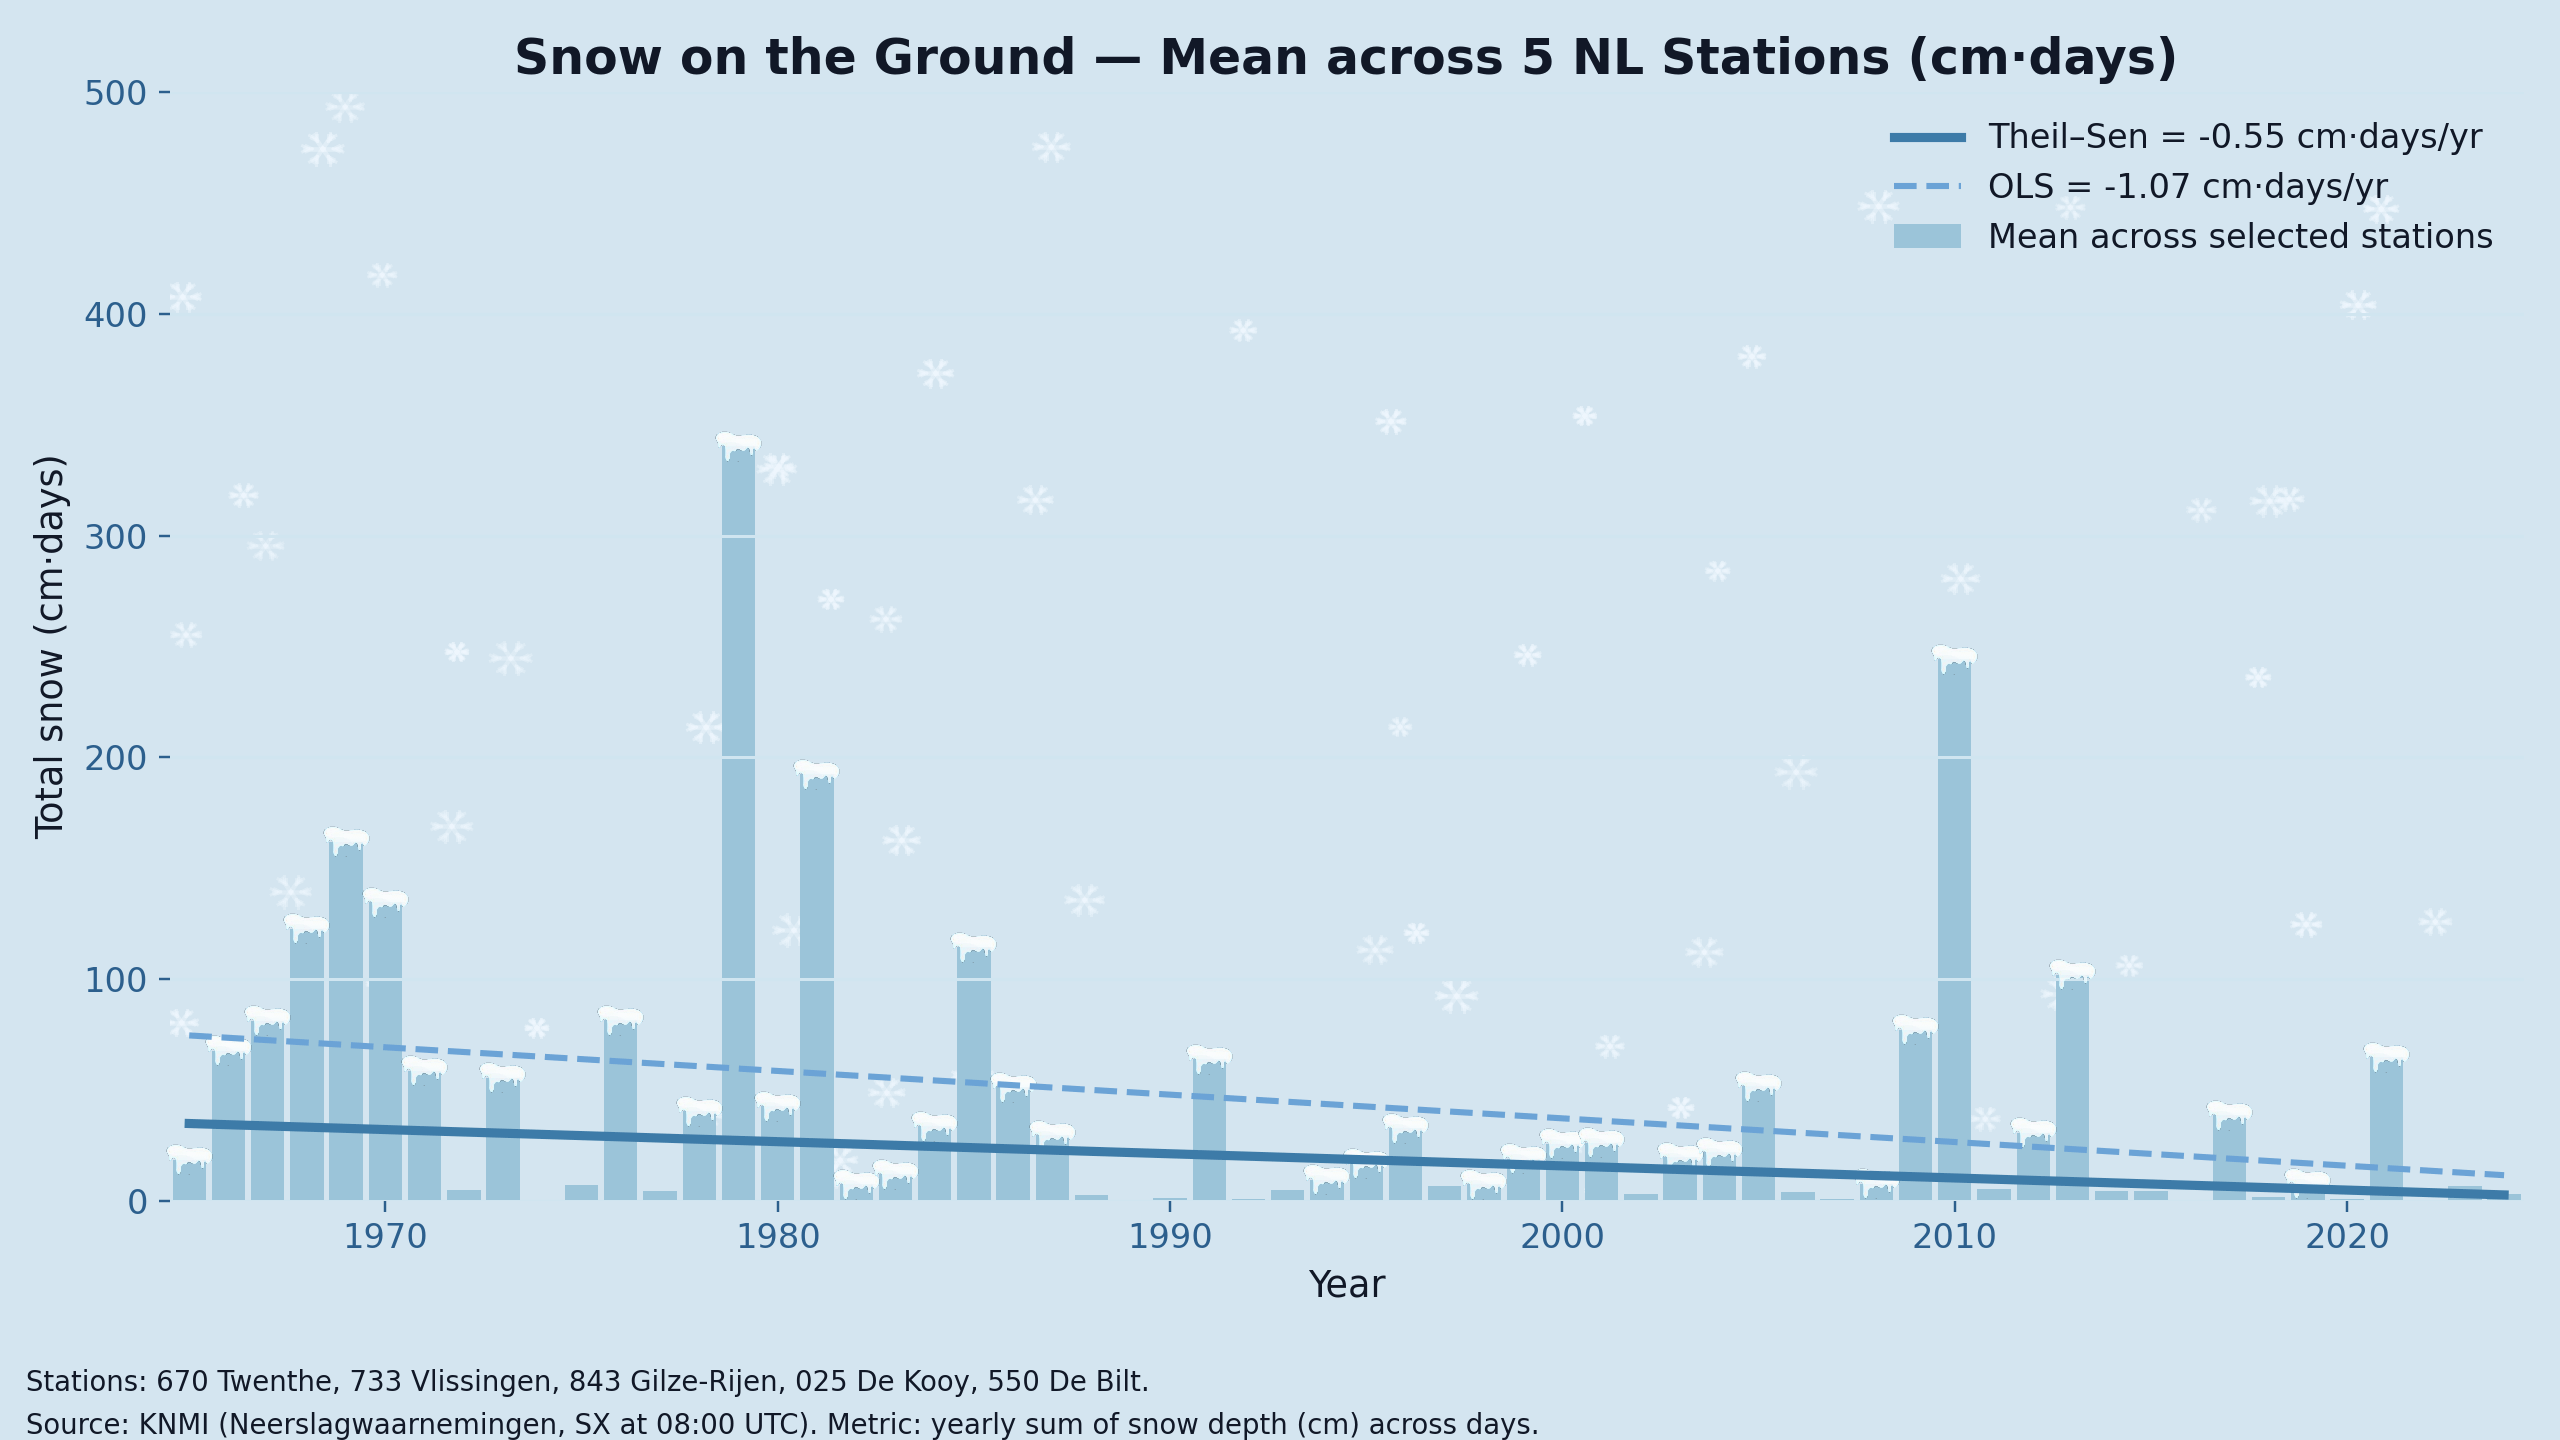
Each bar is a year. The height of a bar is all daily snow depth added up (“cm days”). I averaged five KNMI stations (Twenthe, Vlissingen, Gilze-Rijen, De Kooy, De Bilt).
Two lines: OLS (dashed) is the classic "best straight line" but can be pulled around by a few extreme winters. Theil–Sen (solid) is a robust median-based trend that resists outliers.
I grew up in the ’80s and remember real snow days with sleds, snowball fights, frozen fingers, and that quiet sound right after a snowfall. I'm sad that our daughter barely experienced this. The chart shows why. Please people, let’s turn that curve the other way, for the next generation of kids.
Data: KNMI (daily snow cover, SX, 08:00 UTC).
Posted by sleeper_must_awaken