
Original source: https://landregistry.data.gov.uk/app/ukhpi/browse?from=1970-01-01&location=http%3A%2F%2Flandregistry.data.gov.uk%2Fid%2Fregion%2Funited-kingdom&to=2025-09-01&lang=en
Data tools used: www.plotset.com
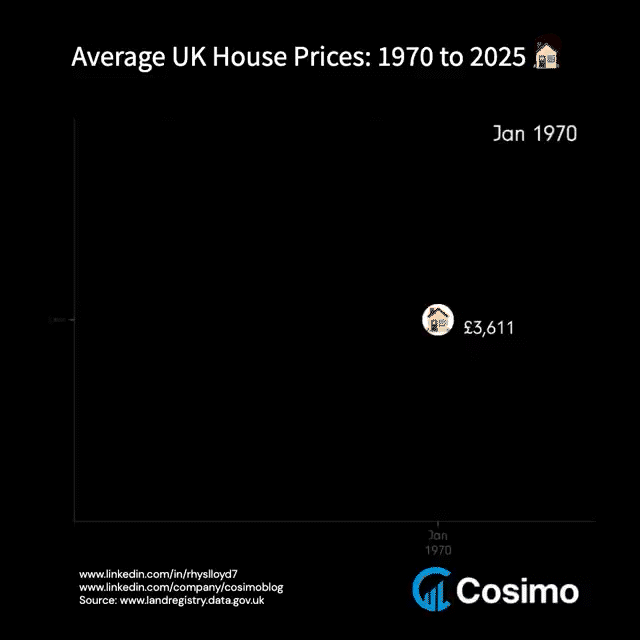
Description: Average UK house price from 1970 to 2025 on a quarterly basis
Posted by rhyslloyd7
21 Comments
I’d like to see this graphed on top of the minimum wage throughout the years, just so I can justify my tears
Very cool – would be interesting to track inflation and average wages on the same graph, to see how the relationship to these basics has changed. Then broadcast it 24/7 on the BBC until boomers finally accept they might need to stop blocking new houses…
This would be a lot more useful if the house prices were adjusted for inflation.
Why would you make this a gif, instead of an animation with a time bar scroller?
No one’s talking about how house prices went from below 4k in 1970 to over 9k in 1975…
Somethings telling me peoples wages did not double in 5 years.
I think the problem is hoarding of houses but also “first come first serve” where most houses probably got bought out in the early 1970s causing supply to fall below demand therefore increasing house prices.
“First come first serve” is only possible if something big like a world war happens
Rookie numbers. [Look at Australia](https://tradingeconomics.com/australia/average-house-prices) ($1.02 million AUD as of June 2025, equivalent to £506,000)
It’s fine!!!!! It’s all gonna be fine
How do people buy a house that costs that much?
There was a building company exec talking the other day about the government needing to offer support for first time buyers and that house prices are important for the economy. It’s exactly the opposite. House prices are stifling people taking risks and moving for new jobs. The work hard, buy a house deal has been destroyed so that pensioners can drive around in suvs.
Clearly 110k over valued, the next bust will be epic
Let’s put this, median wage, and royal family net worth all on the same graph
Now do average salaries and watch how majority are being priced out
There is absolutely zero need to make this animated. It adds zero value. All that does is make me wait to actually see the data. And then when I *can* see it, it loops back to the beginning, so I *can’t* see it any more.
There is no reason to animate a simple line graph, ever. It makes everything worse, less readable, and more annoying.
Downvoted.
Put that next to currency inflation at the same time.
how was average house prices in UK less than 2,000 pounds in the 1960s?
The UK is a glorified real estate market scheme in the form of a country
My first house in my 20’s was a 2-bedroom with large rear garden, parking, etc. It was an absolute state (sold by a bankrupt, rotten and disgusting throughout, etc.) and not in a nice location at all, but it was a good “first home”, and not far from London.
My second house in my 30’s was a 3-bedroom 1930’s semi with a huge rear garden, nice front garden, etc. etc. It was in a nice area, it was a lovely house. We were lucky to get it and that mainly happened because we were FAST (from viewing to offer in an hour, from offer to completion in a couple of weeks). It was inside Greater London.
My third house – now that I’m in my 40’s, single again, was worried about any potential mortgage going into retirement, earning more than I ever have, etc. – is a tiny one-bed former-council bungalow in the middle of nowhere in a tiny, inaccessible village, nearly an hour outside London. All my neighbours are council tenants. Most of them are elderly/disabled. It was, quite literally, all I could afford, and the only thing which “balanced” in terms of salary expectations, commute distance and house price. Most of the residents don’t go out because… there’s nowhere to go. The council like to put completely disabled people there because there’s no chance of them popping to the shops (literally several miles away, as is the post office, library, etc. – basically ANYTHING that you need, you need a car for).
I’m glad I did actually push myself to get that 3rd house, or I would forever be renting or living in council housing (and single male? No chance of anything decent) until the day I die. But it’s quite clearly the “worst” house I’ve ever owned in terms of actual square footage (my rear garden is 3m x 3m), living space, build, potential for expansion, etc. It’s literally classed as undesirable because of those attributes… it’s just too far away from anything, and even the council are stopping using it and building new houses elsewhere.
Even then, I paid more than most people could EVER afford to pay for a first home, even as a couple, to get it. It’s only because I have a good job and that I can commute to a decent workplace from there.
It wasn’t chosen specifically for this, but it’s likely going to be the house I retire in and the house I die in. I cannot afford to do this again, and as it is my mortgage is going to go right up to retirement.
Honestly, I don’t understand how people are buying places now. Even adjusted for inflation, even clubbing together with a partner/friends, even deciding to commute from a long way away, etc. I don’t see how most people would ever be able to buy even the house they’re currently living in if they needed to again. Most of them would never be awarded a mortgage for the current value. Let alone the millions on benefits, living in council accommodation, etc.
Everyone’s going to end up in little 1-bed tiny studio hovels for much of their life within a few decades.
Houses in the UK are cheap, in the Netherlands it averages at 400k (Euro’s) or something
If I say what I think should happen to boomers I will get perma banned .
This data is not beautiful.
And STILL my parents and grandparents managed to lose money when selling most of their properties…