
![[OC] 🚀 All Space Missions from 1957, Visualized](https://www.byteseu.com/wp-content/uploads/2025/11/42704inuy62g1-1536x740.gif "[OC] 🚀 All Space Missions from 1957, Visualized")
What patterns surprise you most? I'm happy to dig into the data further! Check out and edit the full visualization.
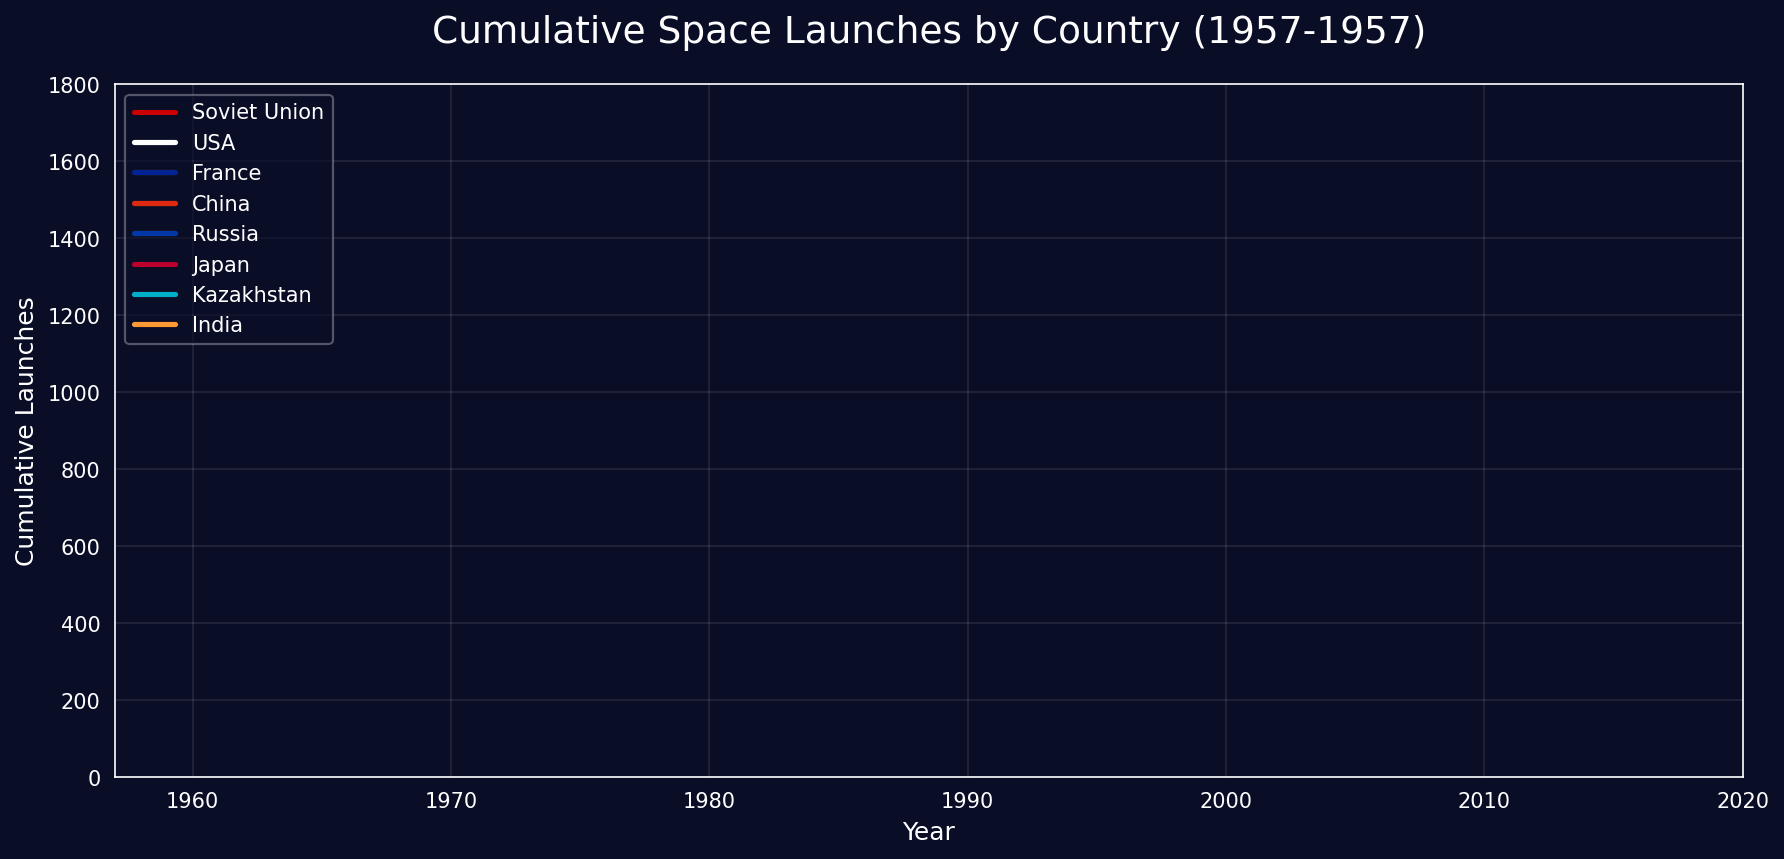
I created an animated visualization tracking every space launch from 1957 to 2020, and the patterns that emerged tell a pretty cool story:
- The Cold War space race was real: By 1991, the Soviet Union had launched 1,703 missions vs USA's 1,349. The USSR dominated the early decades with their relentless launch cadence.
- China's quiet rise: Starting in the 1970s, China steadily climbed from zero to 268 launches by 2020, now firmly in the top tier of spacefaring nations.
- The privatization revolution: In the 1950s-60s, 100% of launches were government-run. By 2020, private companies accounted for 34.6% of all launches – a dramatic shift in how we access space.
- RVSN USSR remains the GOAT: The Soviet Strategic Rocket Forces still hold the all-time record with 1,777 launches – a testament to the scale of Cold War space operations.
Tools: MOSTLY AI, Python (pandas, matplotlib), Plotly.js for the interactive version.
Posted by SyllabubNo626
10 Comments
The ESA, and its predecessors, have 85 launches which aren’t here.
This post represents what this sub has become: rule breaking posts that promote some AI tool.
* animation that should’ve been a simple static line plot
* bad color coding. Really hard to distinguish among red/orange lines or blue lines. All the colors in the world and your chose this.
* advertisement in a form of “organic” post
I need a bingo card for this
You missed the UK’s single space launch.
You should connect Soviet Union with Russia.
I don’t think this is a good representation. Launching stuff into space really means nothing in terms of progress
Missing Israeli space launches
Cutting it off at 2020 misses the insane increase in cadence we’ve seen since private space really democratised launch.
would have been good for the soviet/russia data to be combined, and maybe a color change at 1990 or so. It really is the same program, just change of government
Where is Germanys first successful break of the 100km in 1944?