
![[OC] I Tracked the Bloom Dates of Every Flower in My Garden - 2025 verison](https://www.byteseu.com/wp-content/uploads/2025/11/5o5dk1i4z93g1-792x1024.jpg "[OC] I Tracked the Bloom Dates of Every Flower in My Garden – 2025 verison")
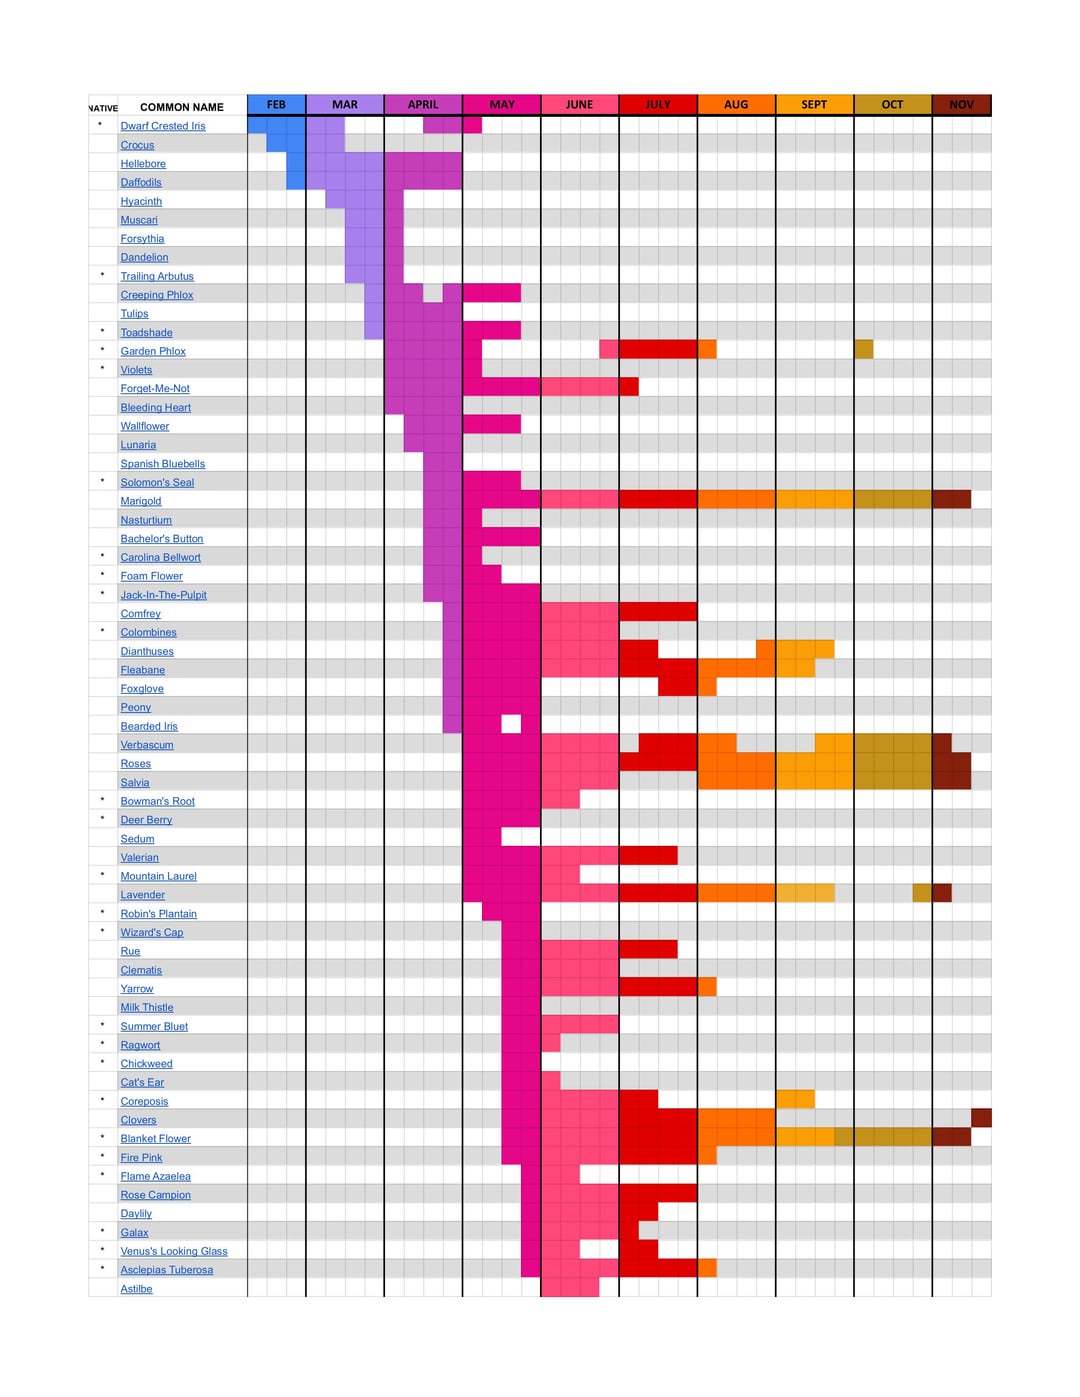
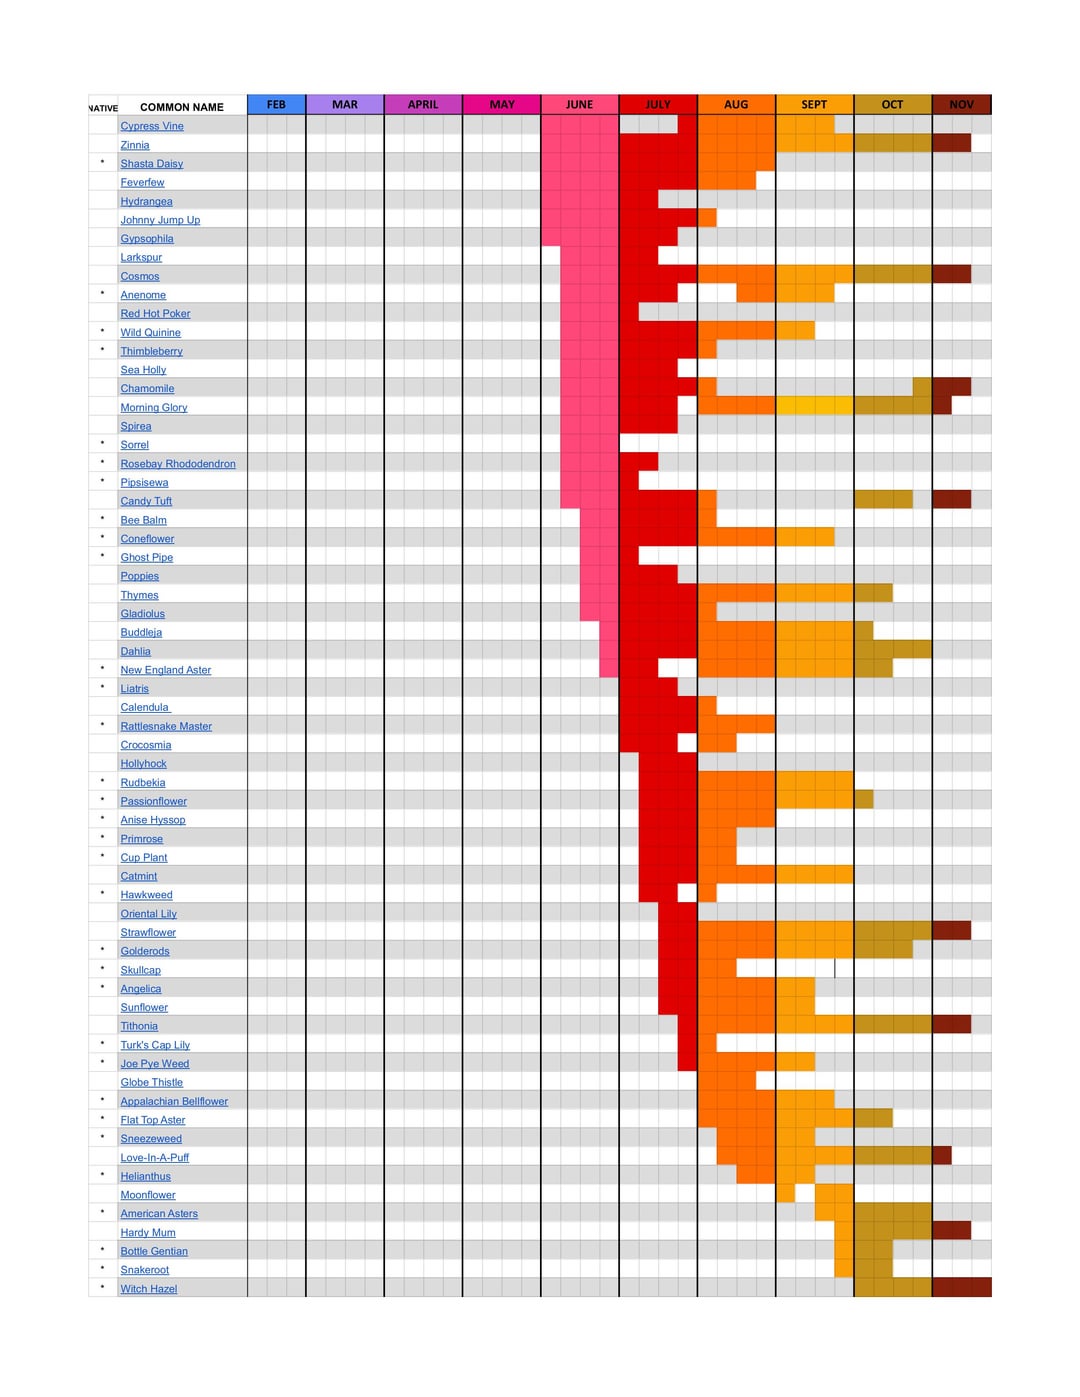
I collected the data by walking around my property once a week, every week and marking what I saw. I break each month into 4 weeks, which I know is not a perfect system but works well for my purposes.
I record this data with a marker in a handwritten notebook, but have input the information into Google Sheets for sharing purposes. This year I've linked each species to a page about that plant so when there is confusion about exactly what the common name refers to, it's clear.
Link to the Sheets doc with hyperlinks for each species
I created and started using this chart with the goal of having the longest possible flower season without any breaks. The data has proved really helpful as a gardener not only for filling gaps, but also for easing my mind when I say "BUT WHERE ARE THE CROCOSMIA?!" and I consult my data to see that on average, they will come up a week from now.
This is the 5th year I've created this chart and shared it in some form on Reddit. I didn't start putting the data into Sheets until last year.
Posted by M-Rage
2 Comments
Sorry if you answered somewhere else, but what zone are you in?
This is amazing, thank you for sharing!! But same question as the other commentor: roughly what part of the world are you in? I’m 52° North and have a feeling you live somewhere similar, or a bit warmer. I’d like to corrolate it a bit with my own garden plants, and we share a lot of them. 😉