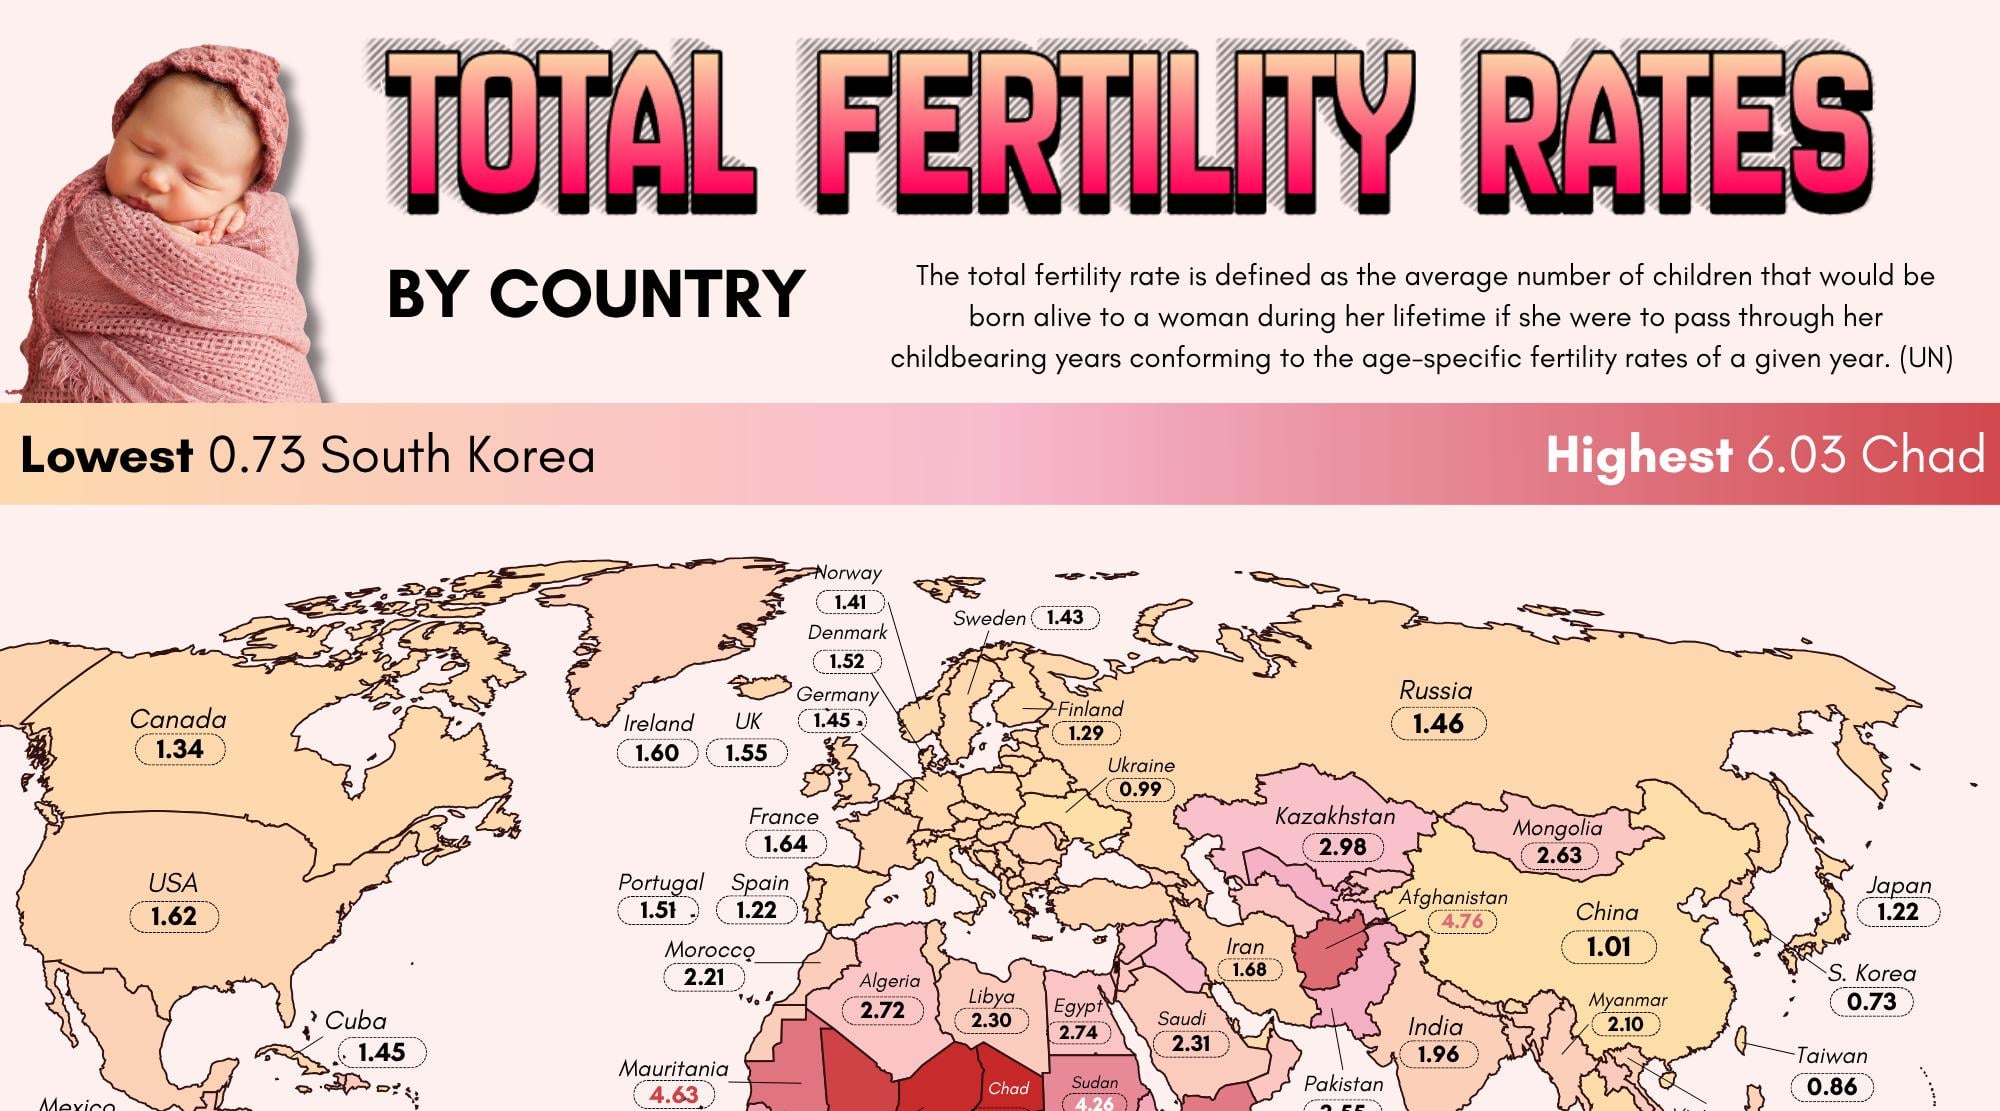
I was under the impression that one could submit a non-OC image as long as the link was provided in the body, but apparently that’s not the case. So here’s the (exceptionally pretty!) graphic itself.
Wish the color scheme differentiated more between the smaller values
0.86 Taiwan and 1.61 Brazil are the same color and those are dramatically different fertility situations.
Whereas 5.9 Congo and 4.3 Nigeria are shown with very different shading.
flower-power-123 on
What do you think of the reliability of the data for this chart? I think a lot about this issue. [Malcolm and Simone Collins](https://www.youtube.com/watch?v=euIfvODG0aM&list=PLg8R-fWRBuHEUIDpQwUqaPQqRwpkPqOJJ) have been obsessed with this problem. They write and speak about it in apocalyptic terms. A few items that I have discovered in the last few months:
Another issue that I have with this chart is that it lacks the concept of time. For instance I have been learning about Cyprus recently. Cyprus is an island nation in the Mediterranean. The fertility rate there dropped below the replacement rate more than 20 years ago. The young people that are now entering the job market are one half of the number that are retiring. This has been going on for a long time and Cyprus is responding by making it easier to get Cypriot citizenship. The plan is working. Something near 10% of the population is now expat Israelis that have permanently relocated to Cyprus. This is moving the dial on politics. Imagine this story playing out all across the globe.
This is a sleeper issue that will become a crisis in the next five years.


3 Comments
I was under the impression that one could submit a non-OC image as long as the link was provided in the body, but apparently that’s not the case. So here’s the (exceptionally pretty!) graphic itself.
https://preview.redd.it/4q5fx26hyh3g1.png?width=1200&format=png&auto=webp&s=de1d8bfcffdfb94e20bb665915debed00582b2a3
Wish the color scheme differentiated more between the smaller values
0.86 Taiwan and 1.61 Brazil are the same color and those are dramatically different fertility situations.
Whereas 5.9 Congo and 4.3 Nigeria are shown with very different shading.
What do you think of the reliability of the data for this chart? I think a lot about this issue. [Malcolm and Simone Collins](https://www.youtube.com/watch?v=euIfvODG0aM&list=PLg8R-fWRBuHEUIDpQwUqaPQqRwpkPqOJJ) have been obsessed with this problem. They write and speak about it in apocalyptic terms. A few items that I have discovered in the last few months:
[The UN is Lying About Latin American Birth Rates: The Real Numbers are Shocking](https://www.youtube.com/watch?v=iPHXWBeYZr0)
[China’s vanishing population and the lie of 1.4 billion people](https://www.youtube.com/watch?v=gsIg-_5Yl_8)
Another issue that I have with this chart is that it lacks the concept of time. For instance I have been learning about Cyprus recently. Cyprus is an island nation in the Mediterranean. The fertility rate there dropped below the replacement rate more than 20 years ago. The young people that are now entering the job market are one half of the number that are retiring. This has been going on for a long time and Cyprus is responding by making it easier to get Cypriot citizenship. The plan is working. Something near 10% of the population is now expat Israelis that have permanently relocated to Cyprus. This is moving the dial on politics. Imagine this story playing out all across the globe.
This is a sleeper issue that will become a crisis in the next five years.