
![Increase In People Living Alone Per County (1970 vs 2020) [OC]](https://www.byteseu.com/wp-content/uploads/2025/11/krhfi1u9ys3g1-1536x1187.jpeg "Increase In People Living Alone Per County (1970 vs 2020) [OC]")
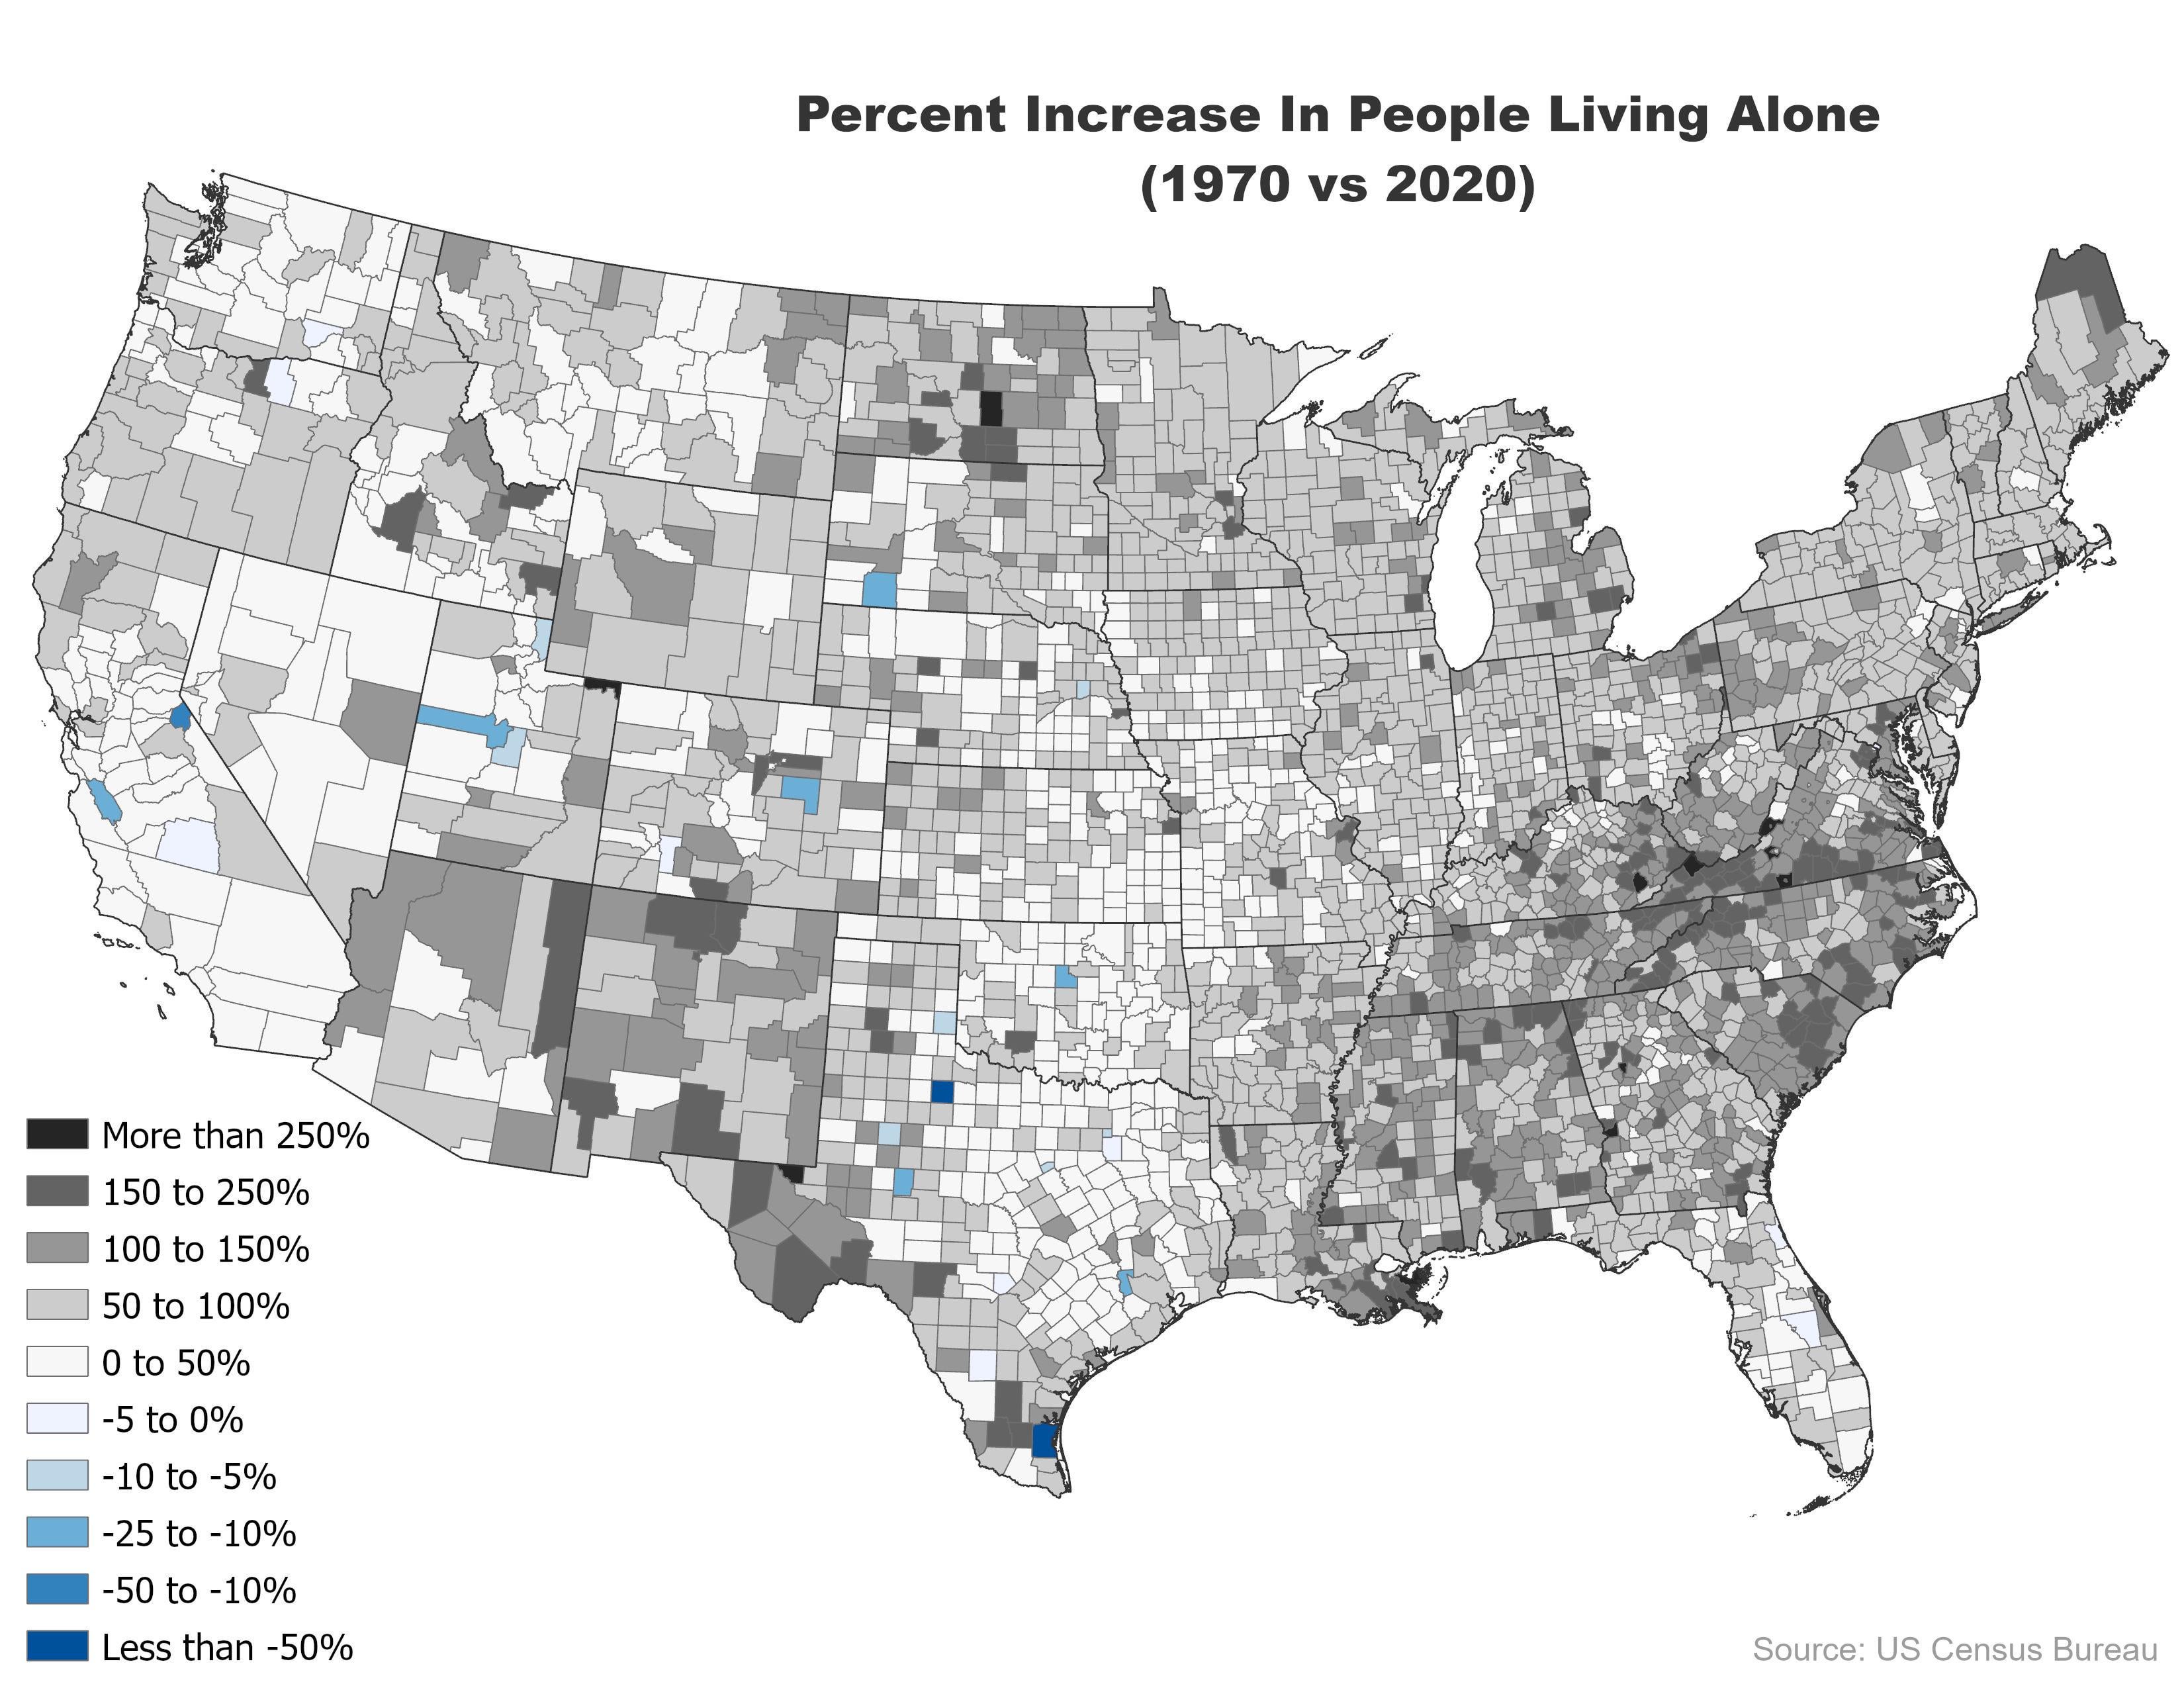
Source: US Census Bureau
Tools: Excel, ArcGIS
This post made me curious to see how living alone has changed across the US. While most counties have seen increased amounts of people living alone, some counties have experienced decreases. The map is showing percent increases, not direct percents.
Top Five Increases:
– Chattahoochee County, Georgia: 532.4%
– Loving County, Texas: 378.6%
– Henry County, Virginia: 302.2%
– Buchanan County, Virginia: 300.0%
– Clayton County, Georgia: 297.2%
Top Five Decreases:
– King County, Texas: -100.0%
– Kenedy County, Texas: -59.9%
– Alpine County, California: -34.1%
– Oglala Lakota County, South Dakota: -22%
– Juab County, Utah: -22%
Posted by BRENNEJM
2 Comments
This is just a guess, but I think the increases in the Southwest and on the Southeast Coast would probably be from retirees who have been widowed moving into either assisted living, or cities where they simply feel more comfortable and independent.
What happened in King County that made absolutely nobody live alone?