

It’s been a few days since the referendum and a lot has been written about the reason for the result, but most of it is based on the opinions of analysts, and there is little actual analysis of the data – but I saw a few days ago publicationwhere a strong correlation is shown between the outcome of the referendum and the share of right-wing voters in the last parliamentary elections.
I decided to make an overview of the changes between the previous (euthanasia, 2024) and the current (zppkž) referendum by electoral district, depending on the previous support or conservatism/liberalism of the district.
As has been mentioned several times, the voter turnout was low in this referendum, especially in cities where in principle support for euthanasia/zppkž is higher, and the opposite was true in rural areas. I was interested in how the number of voters for and against changed in different environments, or in a more detailed breakdown of the change in participation – I specifically checked this depending on the result of the previous referendum. Since the number of beneficiaries is not the same in all districts, I calculated the difference in the share of voters for each of the options based on the total number of eligible voters in the district, so that the data by district is mutually comparable.
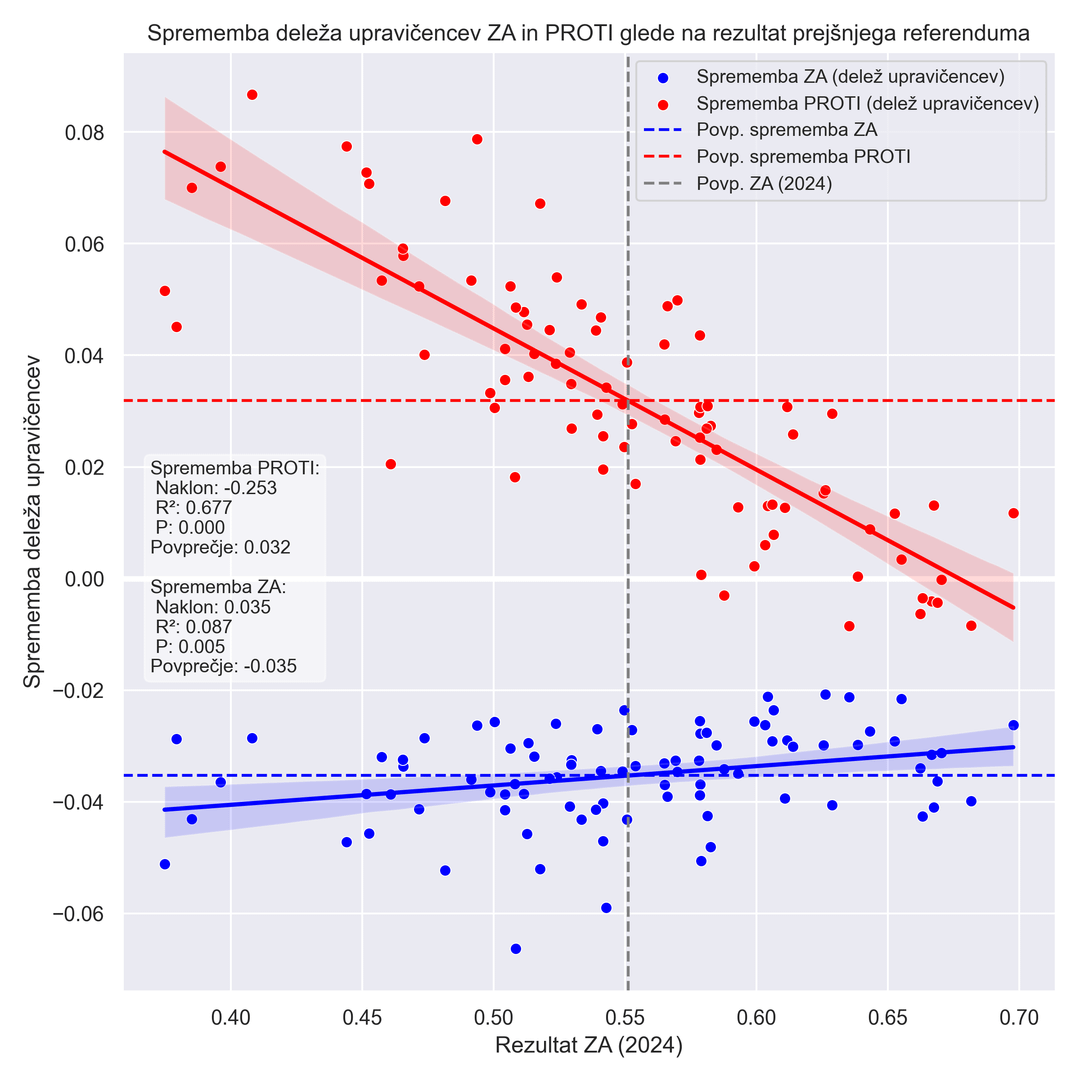
Figure 1 shows the change in the share of voters FOR and AGAINST between the previous and this referendum by district, depending on the result of the previous referendum (proportion of YES among all votes) in a given district. We can see that the proportion of voters in favor decreased in all districts, on average by 3.5%, but on the other hand, the proportion of voters against increased in most districts, but not all (by 3% on average) – which caused the law to fall. At the same time, the figure also shows the linear dependence of the changes on the previous result.
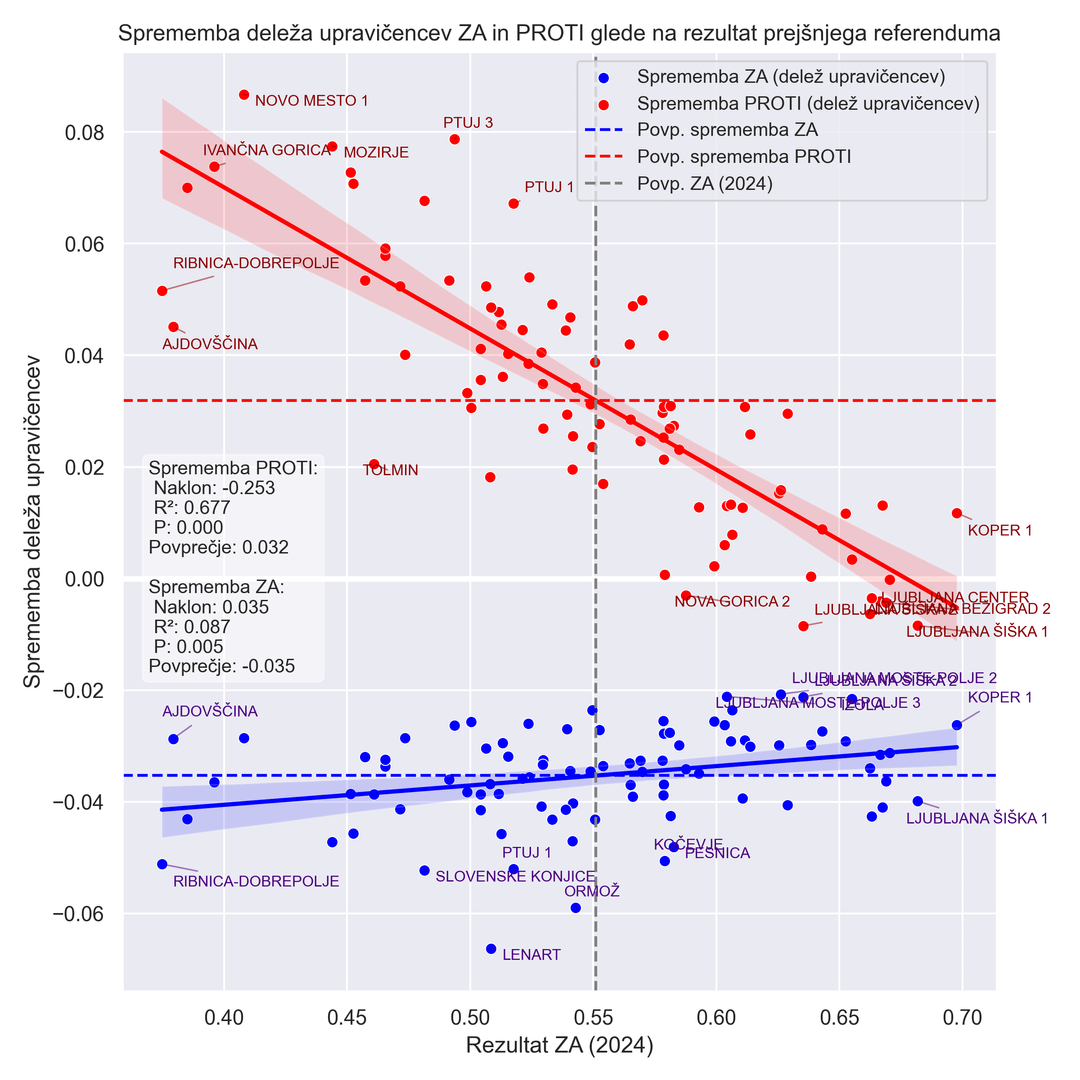
The conservatism of the district strongly influences the change in the proportion of PROTI voters – in more liberal districts, this almost did not change or even fell (e.g. Ljubljana Šiška 1, Ljubljana center, Koper 1), but on the other hand, in more conservative districts it increased sharply, even for up to 8% of all beneficiaries (e.g. Ivančna gorica, Novo Mesto 1). The R^2 of the linear regression is 0.68, so the linear influence of the previous outcome explains well the greater part of the variance in the changes. The referendum campaign therefore mobilized opponents more successfully in conservative districts. On Figure 2 some extreme and most prominent districts are marked.
At the same time, the changes in the ZA share are much more even and the trend, although existing, hardly affects the change. Here, too, the trend indicates that the campaign against the law also successfully dissuaded voters who voted for euthanasia in last year’s referendum from supporting the new law in more conservative districts (alternatively, that the campaign to support the law was more successful in retaining supporters in liberal ones).
From the trend some districts stand out stronglye.g. the decline in support is even stronger than it should be based on the trend, v Lenart, Ormož and Slovenske Konjice. The increase in the proportion of opponents is well above the trend in the districts Ptuj 1 and 3, and under the trend is v Tolmin, Ajdovščina and Nova Gorica.
On the hypothesis that liberal voters did not go to the polls due to a lack of motivation ("the law failed because supporters did not like going to the polls" etc.), or that a certain proportion of them support the principle, but not this specific law ("the marriage was bad" argument), we would expect some specific proportion of past supporters to have stayed home or changed their minds. Assuming at the same time that it would be this one the share is similar across the countrythere should be a drop in the number of beneficiaries who are FOR (that is to say absolutely according to the share of all beneficiaries), larger in districts where there was the most support in the previous referendum. Otherwise, the weak trend in Figure 1 indicates the exact opposite (the x-axis is not the share of all beneficiaries who voted YES, but the outcome, i.e. the share of YES among the votes cast, but the two are strongly correlated). A similar consideration of the fact that arguments against across the country would convince a certain proportion of all those who were not against before shows that the marked trend of change in the proportion AGAINST on the graph is exactly the opposite of what was expected.
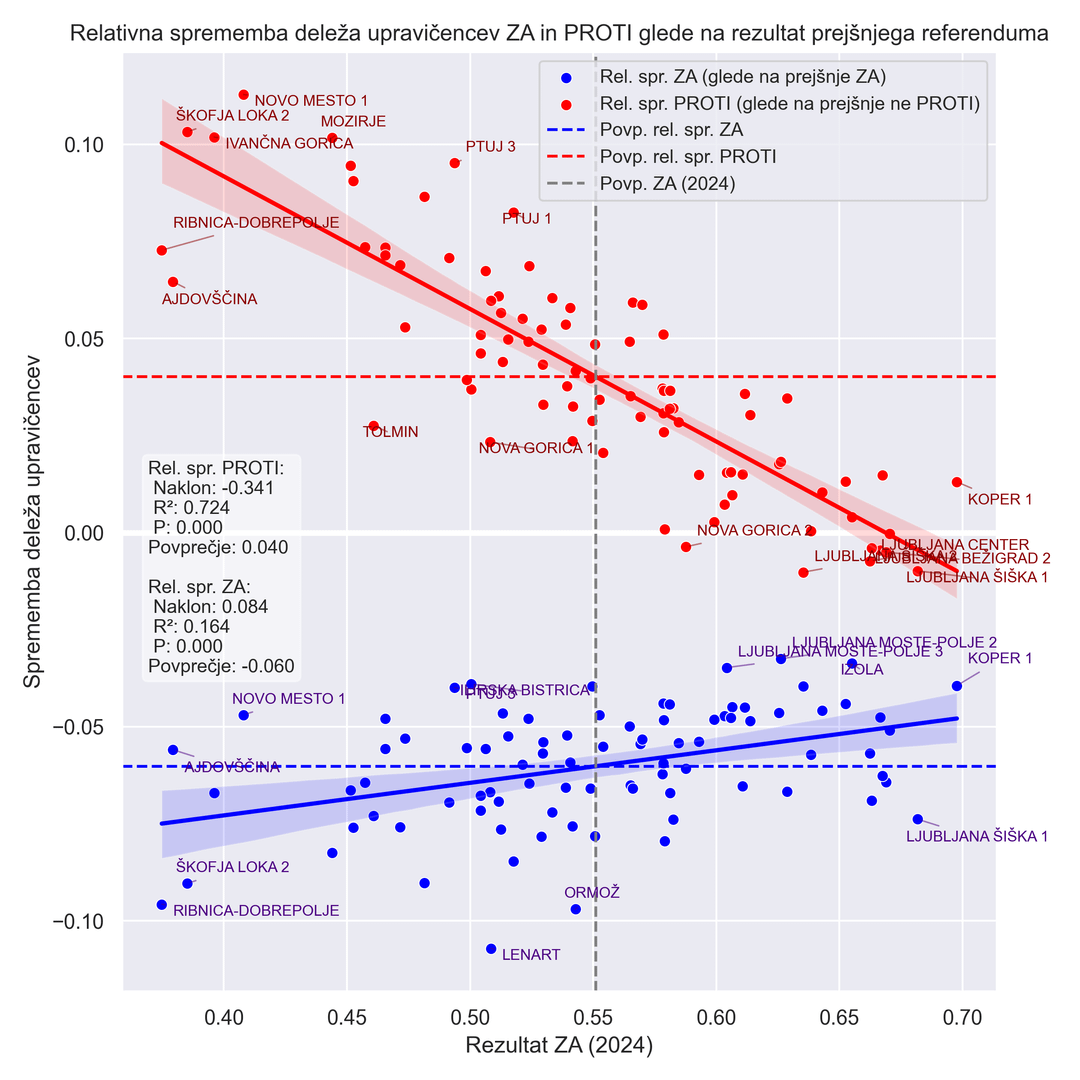
Already Figure 3 the above-defined relative changes in the shares of beneficiaries who are FOR or AGAINST are shown (the change in the share of eligible voters who voted YES, relative to the share of beneficiaries who voted YES in the previous referendum; and the change in the share AGAINST, relative to those who did not vote AGAINST the previous one) Both trends are even stronger here (while the dependence of the change in YES is still weaker than that against AGAINST).
The changes shown on the graph, and thus partly also the result of the referendum, are best explained by kak a factor due to which the increase in the share of PROTI beneficiaries is significantly greater in conservative districts than in liberal onesbut at the same time there is also a somewhat greater decrease in the share of beneficiaries who are FOR – in other words, conservative districts have become even more conservative. To some extent, this may be caused by the influence of the environment (if someone who is not completely determined has many detractors around him, he will become an opponent himself, and vice versa, in an environment with many supporters, he will remain a supporter, even if he would not otherwise be). In my opinion, however, the trend points to the essential greater success of the campaign of opponents of the law in conservative environmentsspecifically because of the influence of the church (more conservative districts are also more rural and more religious) – or because of direct appeals to voters in churches, or because of a larger share of religious residents in the districts that have been the most opposed to euthanasia from the beginning.
I would like to know what you think about the analysis and how you interpret these trends and do you have any explanation for the stronger deviations of some districts?
Tldr: Compared to euthanasia opponents from last year’s referendum, the number of opponents of the law increased significantly more in the most conservative constituencies, where there were already the most of them before. The drop in the number of supporters was somewhat smaller in cities than in rural areas.
https://www.reddit.com/gallery/1p83ekw
Posted by Vmvgsar
8 Comments

Zatipkal sem se v naslovu, moralo bi se začeti Sprememba števila podpornikov in nasprotnikov, če lahko modi prosim popravite:)
Vidim R dam upvote
Morda vi lahko dal še podporo vladi, vendar tega ni po okrajih 2024 vs 2025.
Med volilci levih strank, ki jih poznam, se veliko takih, ki ni podpiralo zakona, referenduma ni udeležilo. Niso hoteli biti proti (ker nočejo biti na strani RKC in Primca), hkrati pa niso želeli podpreti zakona, ker so menili, da ni dober.
Na kratko :
Med konzervativnimi volilci je nasprotovanje specifičnemu zakonu dvignilo motivacijo k udeležbi.
Pri liberalnih volilcih tisti, ki niso bili za zakon, raje niso šli na volitve.
Zanimiva raziskava, bravo OP.
Ob vsakem glasovanju imaš ljudi ki so vzdržani. Imho so razlogi proti pretehtali da so zmagali riti na voliščam
Izvrstna objava kakor tudi analiza. Me veseli da sem še nekogar navdušil da še kaj takega objavi.