[OC] Do Prime Numbers have “memory”? I analyzed the first 37 Billion primes (up to 1 Trillion) to visualize the bias in their last digits
Posted by anotherFranc

[OC] Do Prime Numbers have “memory”? I analyzed the first 37 Billion primes (up to 1 Trillion) to visualize the bias in their last digits
Posted by anotherFranc
20 Comments
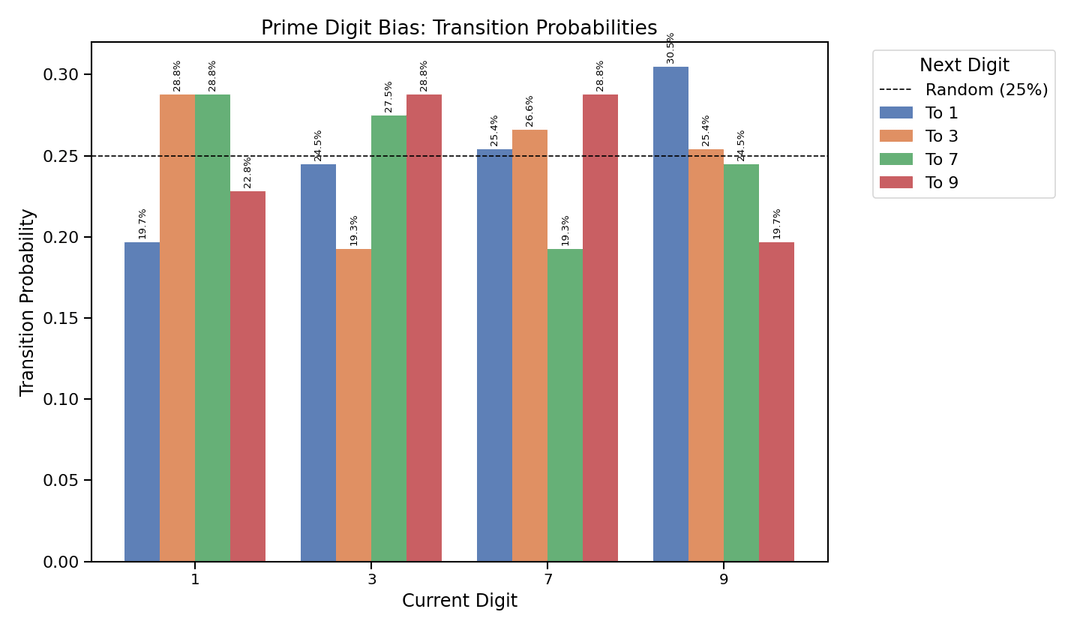
The Context: We are often told that prime numbers behave pseudo-randomly. If you look at the last digit of a prime (in base 10), it can be 1, 3, 7, or 9. You’d expect a 25% chance for each, and a 25% chance for the next prime to end in any digit.
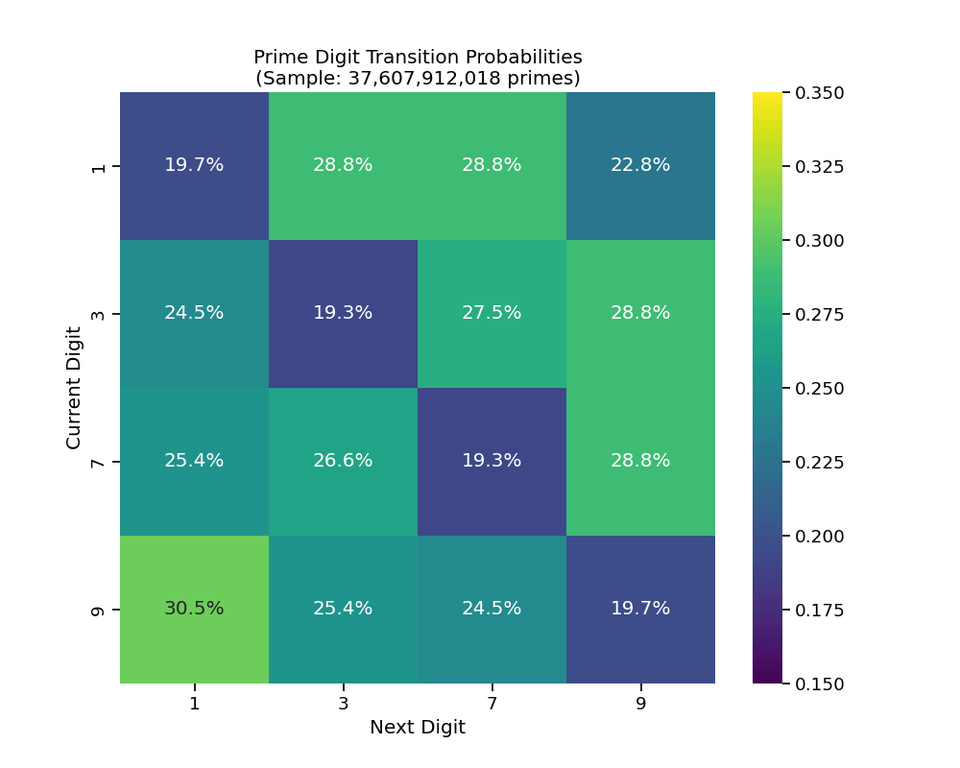
The Visualization: I wanted to verify the Lemke Oliver & Soundararajan (2016) discovery on a massive scale. This heatmap visualizes the probability that a prime ending in digit Y (Y-axis) follows a prime ending in digit X (X-axis).
Key Findings:
– The Diagonal Repulsion: Look at the dark diagonal line. Primes “hate” repeating their last digit immediately.
– If a prime ends in 1, there is only a ~19.7% chance the next one ends in 1 (instead of 25%).
– This bias persists even after scanning 37 billion primes.
Technical Analysis: I built a custom high-performance database containing all 37,607,912,018 prime numbers up to 1 Trillion and counted every transition.
Data Snippet (Deviation from Randomness):
1 -> 1: -5.35% (Strong Repulsion) 3 -> 3: -5.74% 7 -> 7: -5.74% 9 -> 9: -5.35%
Source: Computed myself using a custom binary bitmap database (Mod 20 Wheel Factorization). Tools: Python (computation), Matplotlib/Seaborn (visualization).
This is so nerdy. I love it.
You appear to have not made any attempt to display this data beautifully. These are very basic plots with bad colors, bad font sizes, bad labels and no way to understand what is being displayed by just looking at the visualizations.
This does not belong here until some additional effort is put into the visuals
This looks great, and maybe I’m totally wrong, but wouldn’t two repeating last digits indicate a higher probability, that the whole number is divisible by 11 or something?
Essentially, the definition of a prime would directly lead to this result?
(I might be totally wrong on this, I’m not that deep into math.)
EDIT: Ooops, and I misunderstood that OP is looking at consecutive primes. My bad.
Why would we expect the ones digit of the next prime to be equally likely to be 1, 3, 7, or 9? Especially repeating the next digit seems unlikely cause it has to “miss” 3 other candidates to get there.
base 10 is kind of arbtrary, do other bases and you can get it published!
Now do the same for all the prime numbers
Wow look at the narrow spread on that ~19.5% chance to repeat the last digit. I wonder if these values look much different of you slice the range of primed you sample differently.
Right now you do 1 to 1 trillion. What about 1 to 500 billion vs 500 billion to 1 trillion, etc. the narrow spread is so interesting when the other transitions are all over the place.
Would be great to see this same analysis in multiple other bases than 10. Especially interesting would be to looks at prime bases vs highly composite ones to see if there are any discernible differences.
How is the distribution in the whole dataset? Do 25% of all Primes end in 1,3,7 and 9?
The first diagram seems to be symmetric on the bottom-left – top-right axis. Indeed the “Resolution” is very low, because of in base 10 there are only like 4 different possible endings.
What if you converted the primes in your db into a base where there are way more possible endings. I assume the diagram would look the same, but with a higher resolution. Should you use a base large enough, the finer structure of the map would be revealed, which could help us better understand the causes.
At the moment we are looking at a map that has a resolution of 4×4, but what intricate structure it could show if it had e.g. 40×40 or 400×400 resolution?
Or it may turn out to have a different structure in other bases, which again could tell us a lot about why and what exactly is going on.
This seems like a big deal. But I am just a layman. Can someone please eli5 the significance, implications, and possible realworld applications of these findings?
Nice work op. I don’t fully understand the implications, but anyone who builds a clean visualization from a TRILLION INTEGER data sample deserves a high-motherfucking-five in my book
This is really neat! I’m guessing you’re not willing to share the code yet?
I’d be very interested to see the results u/KibbledJiveElkZoo and u/dimonoid123 asked about.
But can you make it a map where Mississippi is dark red?
It would be neat to see this in some base that is large to look and see a more granular result
For those who wanted to see the graph with a higher resolution (base 210)
https://preview.redd.it/gyz03iwrmf4g1.png?width=1600&format=png&auto=webp&s=2759a608f834d83dcfe822f73c6473b825beb7a3
So much of math has advanced because of questions like these.
The Humans by Matt Haig is a Novel about a scientist figuring out the pattern of prime numbers and aliens sending one of there own to kill him and anyone who he told. Watch out OP
“If a title contains a question, the answer is no.”
Very strange that it isn’t symmetric. So transition probability of 1->9 is not equal to 9->1, even though the difference obviously is symmetric.