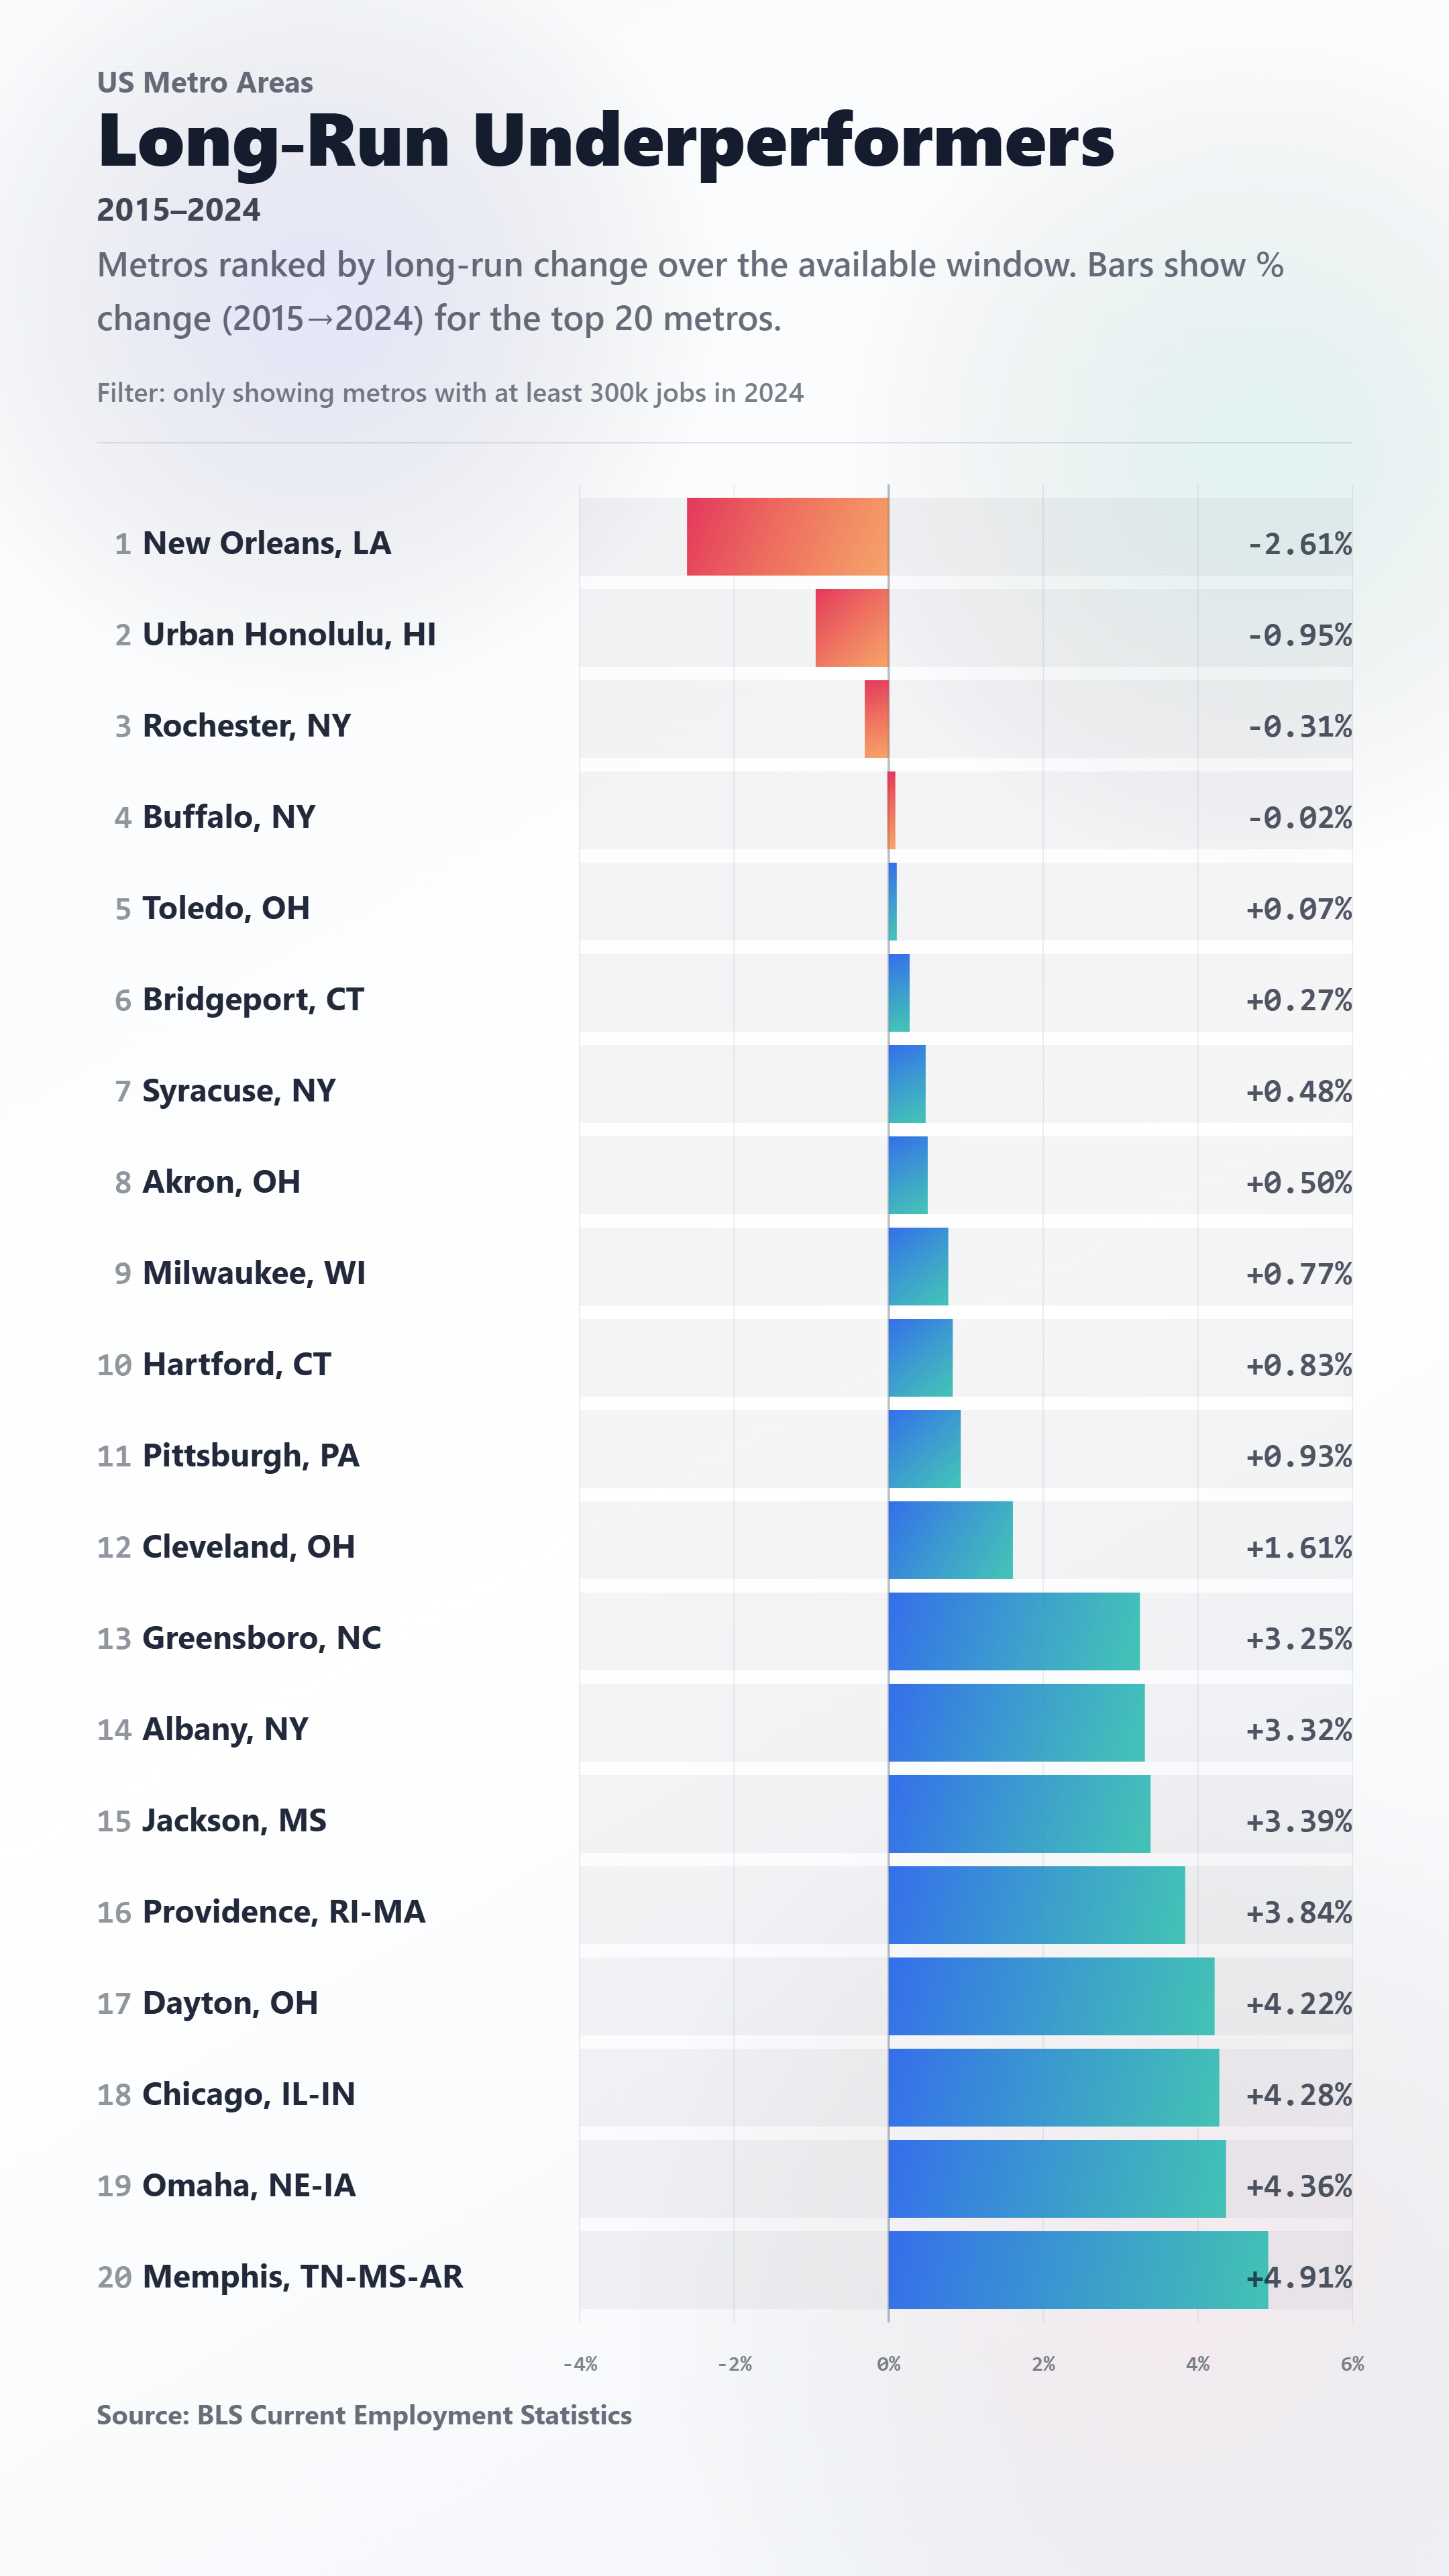
FYI, the national average growth (Total Jobs 2024 – Total Jobs 2015) / Total Jobs 2015 is 11.5%
Posted by SouthNo2807

![[OC] Job Growth Over the Last Decade: Which Major U.S. Metros Underperformed?](https://www.byteseu.com/wp-content/uploads/2025/12/vvn932a2im4g1-864x1536.png "[OC] Job Growth Over the Last Decade: Which Major U.S. Metros Underperformed?")
FYI, the national average growth (Total Jobs 2024 – Total Jobs 2015) / Total Jobs 2015 is 11.5%
Posted by SouthNo2807
13 Comments
Source: BLS Current Employment Statistics
Tools: JavaScript
Buffalo is in the negatives but its bar is going to the right.
This badly needs some labels. “Long-run change” in what? “Top metros” by what measure?
At least for Chicago, the metro area population has barely changed this last decade so this isn’t that surprising
Why isn’t DFW on here? Or Austin? Houston?
And Louisiana is throwing about 97 million at a football coach this week
Love that Detroit isn’t on these lists anymore
New Orleans is a ‘small step’ above a 3rd world country.
I’m confused by the word “top” in the sentence “Bars show % change (2015-2024) for the top 20 metros.”
Since (to name just two places) New York metro and LA metro are not here, this is not a list of the top 20 metros. So is this the top 20 by percent change? – but what would that mean – someone had to cherry-pick these 20 out of the data then. Long Run Underperformers – do you mean that these are the worst 20 major metros in job growth over the time period? Then maybe what you mean is “Bars show the % change in job growth for the 20 worst-performing metros in this time period out of x total metros evaluated.”
So these are the top metro areas for worst job growth? Does that mean New Orleans is the worst metro for job growth or the best on the list of the worst?
What does Rank 1 on this list mean?
Is it just me or are headlines from US media outlets more and more confusing to understand? “long-run change over the available window”, nowhere does it mention jobs or anything. What’s “long-run”? What window? Nowhere does it say _what’s_ actually changing. Is it number of jobs? Employment rate? What?
Top 20 metros based on what?
Is this graph supposed to be the other way around?
There’s data here… but it’s beauty escapes me