
![[OC] I tracked all 677,544 websites that launched in November 2025. Here's the breakdown by country, platform, category, TLD, and launch day.](https://www.byteseu.com/wp-content/uploads/2025/12/bw1u7sahau4g1-1222x1536.png "[OC] I tracked all 677,544 websites that launched in November 2025. Here’s the breakdown by country, platform, category, TLD, and launch day.")
Two months ago I shared my September dataset here (368k sites) and got a ton of useful feedback. Since then I’ve overhauled my methodology – the November dataset is much larger and more accurate.
What Changed Since September
- All TLDs (not just .com) – Previously tracked only .com. Now tracking all extensions: .store, .online, .io, country codes, etc.
- All languages – Removed the English-only filter.
- Improved geo-detection – Country accuracy is significantly better. USA went from 70% → 53% because of better global coverage (not fewer U.S. launches).
November 2025 Summary
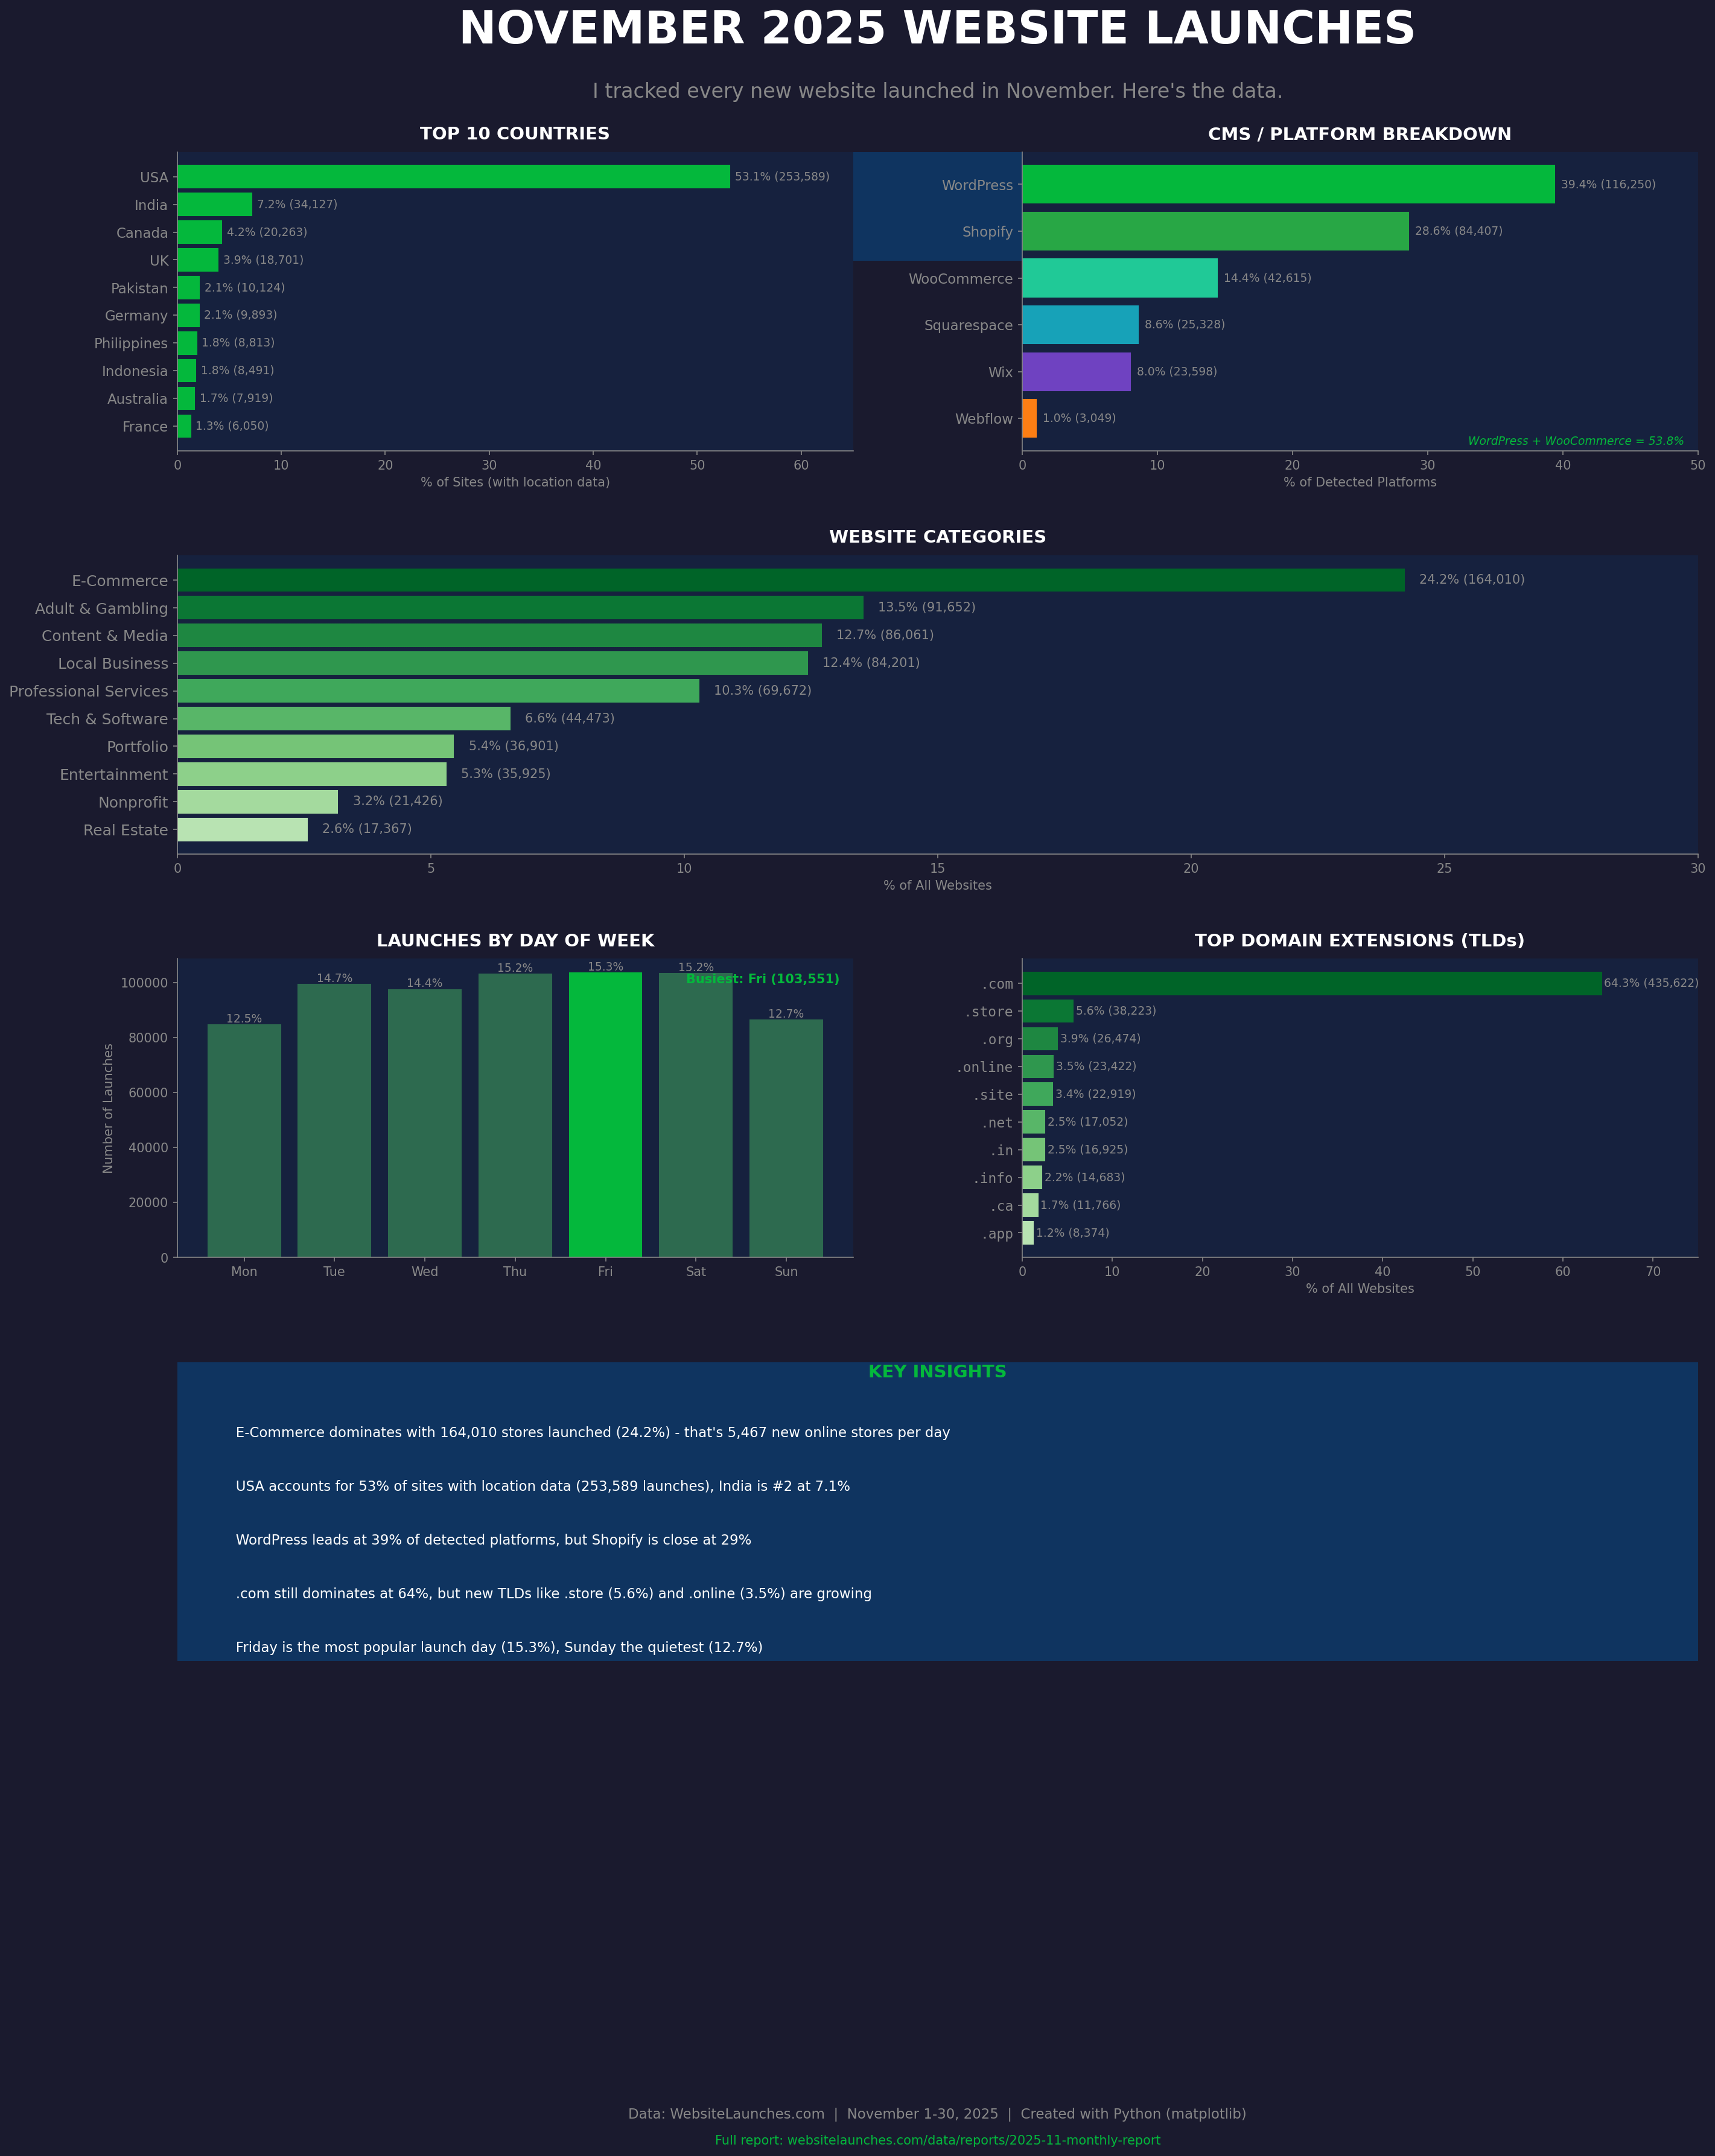
- Total launches: 677,544
- Daily average: 22,585
- Hourly: 941
- Per minute: 15.7
- Countries: 392
Key Findings
Geography
Among the 477k sites with location data:
- USA: 53% (253,589)
- India: 7.1% (34,127)
- Canada: 4.2%
- UK: 3.9%
- Pakistan: 2.1%
The long tail of smaller countries becomes visible with the expanded tracking.
TLDs
- .com — 64.3% (435,622)
- .store — 5.6%
- .org — 3.9%
- .online — 3.5%
- .site — 3.4%
Country TLDs (.in, .ca, .ai, etc.) continue to grow.
Platforms
Detected on 295k sites:
- WordPress: 39%
- Shopify: 29%
- WooCommerce: 14%
- Squarespace: 8.6%
- Wix: 8%
- Webflow: 1% (lower than hype suggests)
WordPress + WooCommerce = 54% of all detected platforms.
Categories
- E-Commerce: 24% (164,010 sites)
- Adult & Gambling: 13.5% (91,652)
- News & Blogs, SaaS, Home & Garden also strong.
Launch Timing
- Busiest: Friday (15.3%)
- Quietest: Sunday (12.7%) People launch every day — differences are small.
Comparison to September
| Metric | September | November | Change |
|---|---|---|---|
| Total sites | 368,454 | 677,544 | +84% |
| USA % | 70% | 53% | −17pp (methodology) |
| WordPress % | 32% | 39% | +7pp |
| E-Commerce % | 36% | 24% | −12pp |
The USA share dropped because global detection improved. Absolute USA counts increased.
Tools Used
- Data: custom Python crawlers + MySQL
- Visualization: Python (matplotlib)
- Full report: https://websitelaunches.com/data/reports/2025-11-monthly-report
Happy to answer any questions or dig deeper into specific categories or countries.
Posted by antiochIst
1 Comment
Porn and media. I would have thought we were maxed out on the latter.