
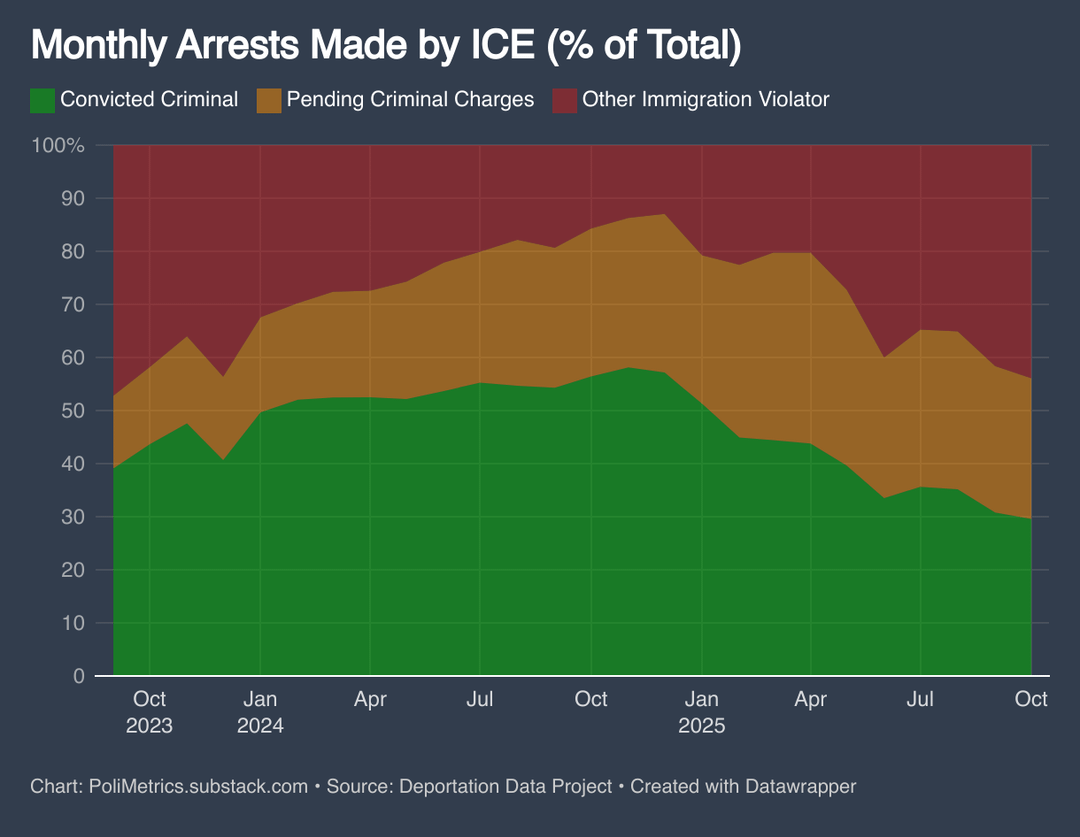
![[OC] Convicted criminals made up 60% of ICE arrests in Nov 2024, now down to 30% in Oct 2025](https://www.byteseu.com/wp-content/uploads/2025/12/t7aucdvan75g1-1024x794.png "[OC] Convicted criminals made up 60% of ICE arrests in Nov 2024, now down to 30% in Oct 2025")
From my blog, see full analysis and interactive charts with country-specific breakdowns and age demographics here: https://polimetrics.substack.com/p/worst-of-the-worst-trumps-ice-arrests
Source: Deportation Data Project | Tools: R & Datawrapper
Under Biden (Oct 2023-Dec 2024), convicted criminals averaged 51% of ICE arrests, peaking at nearly 60% in November 2024. Under Trump (Feb-Sep 2025), that share has consistently declined to about 30% in October.
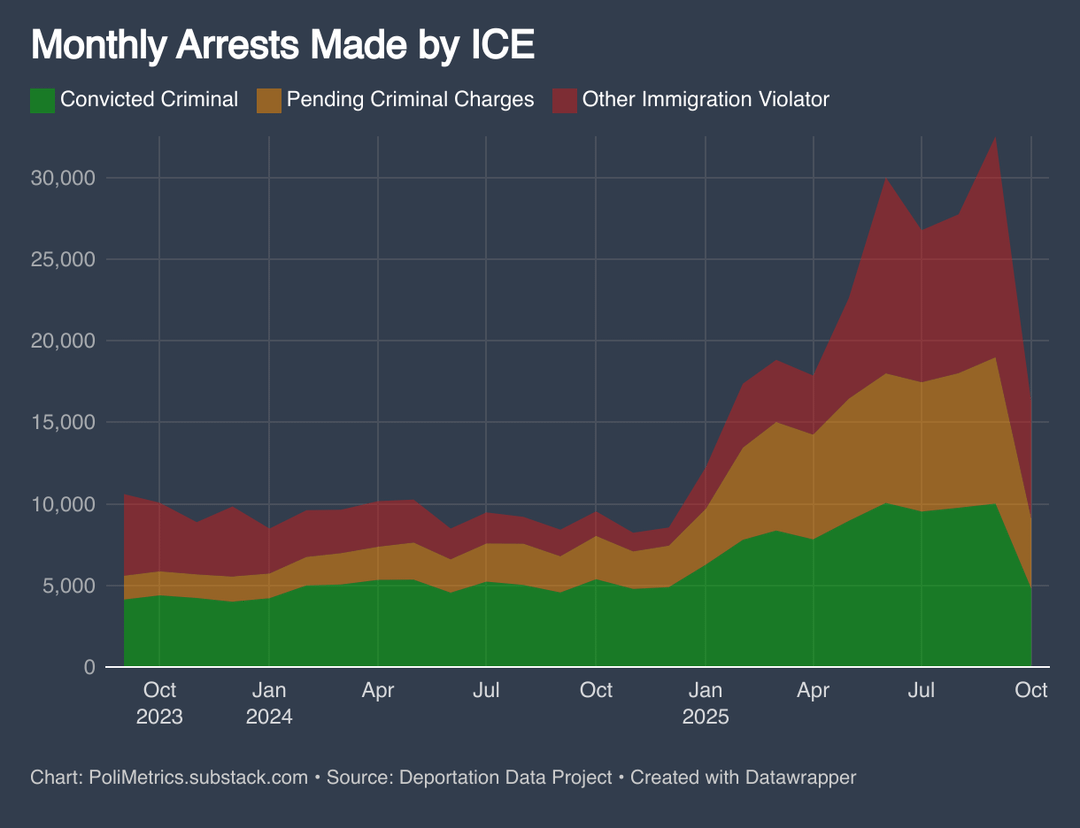
Monthly arrests surged from 9,342 to 24,215 (+159%). While arrests of convicted criminals nearly doubled (+90%), arrests of people with no criminal history tripled (+202%). For every additional convicted criminal arrested, ICE arrests 1.72 people with no criminal record.
This doesn't mean Trump is arresting fewer criminals in absolute terms, he's arresting more of everyone. But the composition has shifted away from the "worst of the worst" rhetoric toward broader, volume-driven enforcement.
Posted by Public_Finance_Guy
32 Comments
Wonder about the “Pending Criminal Charges” category. Once someone is arrested are they categorized as such?
It’s dropping sharply in Oct even when there are still millions of illegals here according to IRS. Does anyone know why?
If someone is in the country illegally they are criminals. Convicted or not.
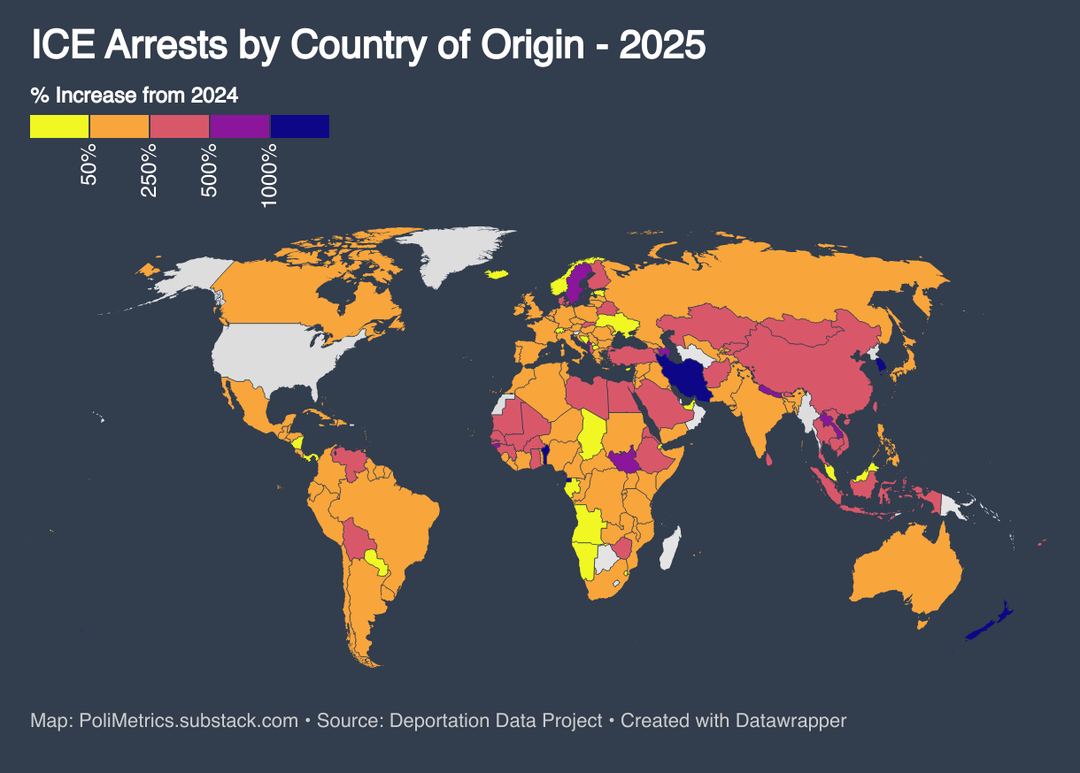
Fourth map: at last, finally someone’s taking the dangerous invasion of Kiwis into our country seriously.
I would be more interested in a breakdown of criminal offences. There are lots of stories about people getting swept up by ICE, having committed minor crimes, sometimes many years in the past. Getting a clearer picture of the makeup of the “convicted criminal” and “pending criminal charges” group would be nice.
What will they do when they run out of each type of target? They will find a new target.
Just as concerning is the increase in arrests for those with “Pending criminal charges”.
*”Due process? Not on my watch!”*
– Hegseth and Noem, 2025 (probably)
Edit: Turns out that there’s some important nuance missing with that label “Pending criminal charges”. See my other comment here for more insight: https://www.reddit.com/r/dataisbeautiful/comments/1pe3rxs/comment/nsa2g0u/
This is what happens when you have a poorly organized, poorly incentivized force governed by quotas. Where I live every day they are snatching people following the rules from their own immigration hearings. They are rounding up landscapers and line cooks and other normal non-criminals. This is what happens when the number of criminals is massively overstated and ridiculous arbitrary quotas must be met.
You list how many are convicted criminals, but how many are there illegally?
This data might be a lot more illustrative if it broke criminal charges down into subcategories. I’d love to see the numbers split into three cohorts: 1) immigration crimes only 2) non-violent crimes and 3) violent crimes. It might perhaps be simpler to split along the lines of 1) civil violation 2) misdemeanor and 3) felony. The second approach would likely lump most DUIs in with immigration violations, but would still be of interest.
Aside: Bizarre that there is a 500%+ increase in ICE arrests of Swedish immigrants.
I dohbf that very much . There is nk reason to trust data in regards to this Administration
how many of those (the total arrests) are illegal in the country and how many are under a visa etc?
This graph needs to be done differently. The Y axis needs to be total monthly arrests. Mostly because I bet the monthly amount of arrests over this time is grealty increasing – and showing the total amounts would not only show the %s, but what is actually changing over time.
I see the data, then I see comments that don’t seem like they looked at the data.
If your position is that is dubious to deport non-criminals, then this data shows that in 2023 we deported a similar percentage of non-criminals as today. The increase in criminals as a percentage happened in both 2024 and early 2025, and we’ve returned to 2023 levels.
Your outrage with having 45% of deportations be for immigration violations should mirror your feelings from 2023.
They’ve offered self-deportation for the past 8 months and they’re still catching illegal migrants. These people really don’t respect our laws and I have lost all sympathy.
Have to wonder for New Zealand if they had 0 last year and 1 this year.
How does this fit with all the reports on wrongfully arrested individuals without criminal charges and without immigration law violations? The whole category of wrongful arrests is missing. They certainly don’t fit “pending criminal charges”.
The worst convicted criminal in the country is the orange goon fake president. Deporting it would improve their statistics.
Isn’t being in country illegally is a felony/crime already?
How many US citizens were arrested?
Unfortunately I don’t think any of the data coming from this administration is trustworthy.
You should keep America on the map, since they’ve kidnapped citizens too
I have no problem with this. If you are here illegally then it’s time you follow the law and self deport.
Considering how many they deport, that’s a lot of criminals gone out of the USA, good for them
This graphics seem to imply ICE hasn’t arrested a single immigrant without some criminality cause?
It’s simply not credible.
MAN, it’s crazy that for months nearly 80% of ICE arrests were for convicted criminals or “pending criminal charges.” Can “convicted criminal” mean went to prison, served time, now out? If so, what would be reason for ICE to re-arrest?
[https://obamawhitehouse.archives.gov/the-press-office/2014/11/20/remarks-President-address-nation-immigration](https://obamawhitehouse.archives.gov/the-press-office/2014/11/20/remarks-President-address-nation-immigration)
“First, we’ll build on our progress at the border with additional resources for our law enforcement personnel so that they can stem the flow of illegal crossings, and speed the return of those who do cross over.”
“I want to say more about this third issue, because it generates the most passion and controversy. Even as we are a nation of immigrants, we’re also a nation of laws. Undocumented workers broke our immigration laws, and I believe that they must be held accountable -– especially those who may be dangerous. That’s why, over the past six years, deportations of criminals are up 80 percent. And that’s why we’re going to keep focusing enforcement resources on actual threats to our security”
-Barack Obama (2014)
As I understand it, 30% is basically the number of americans with some criminal record.
Where is the completely innocent data point?
Nice post.
Your data source doesn’t distinguish between any type of criminal conduct. Are you aware by any chance of any source that does distinguish between types of criminal convictions?
Thx
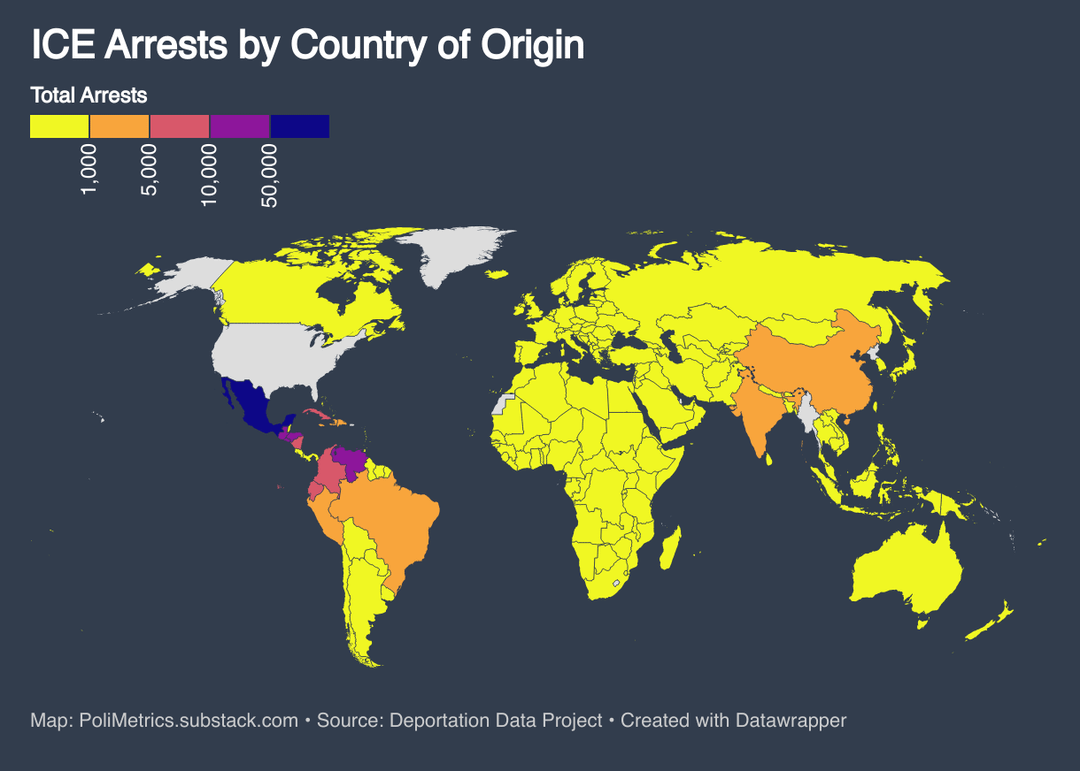
Please add another separation under 1000 in the “by country of origin – total” map.
Almost all of Europe, Asia, and Africa are the same color.
its okay to not want illegal immigrants in your county, they broke the law by being here. be gone.