
![The US Treasury Yield Curve has inverted before almost every recession since 1980. Here is where the 10Y-2Y spread stands today vs historical crashes. [OC]](https://www.byteseu.com/wp-content/uploads/2025/12/qyiyf0pt2b6g1-1536x1241.png "The US Treasury Yield Curve has inverted before almost every recession since 1980. Here is where the 10Y-2Y spread stands today vs historical crashes. [OC]")
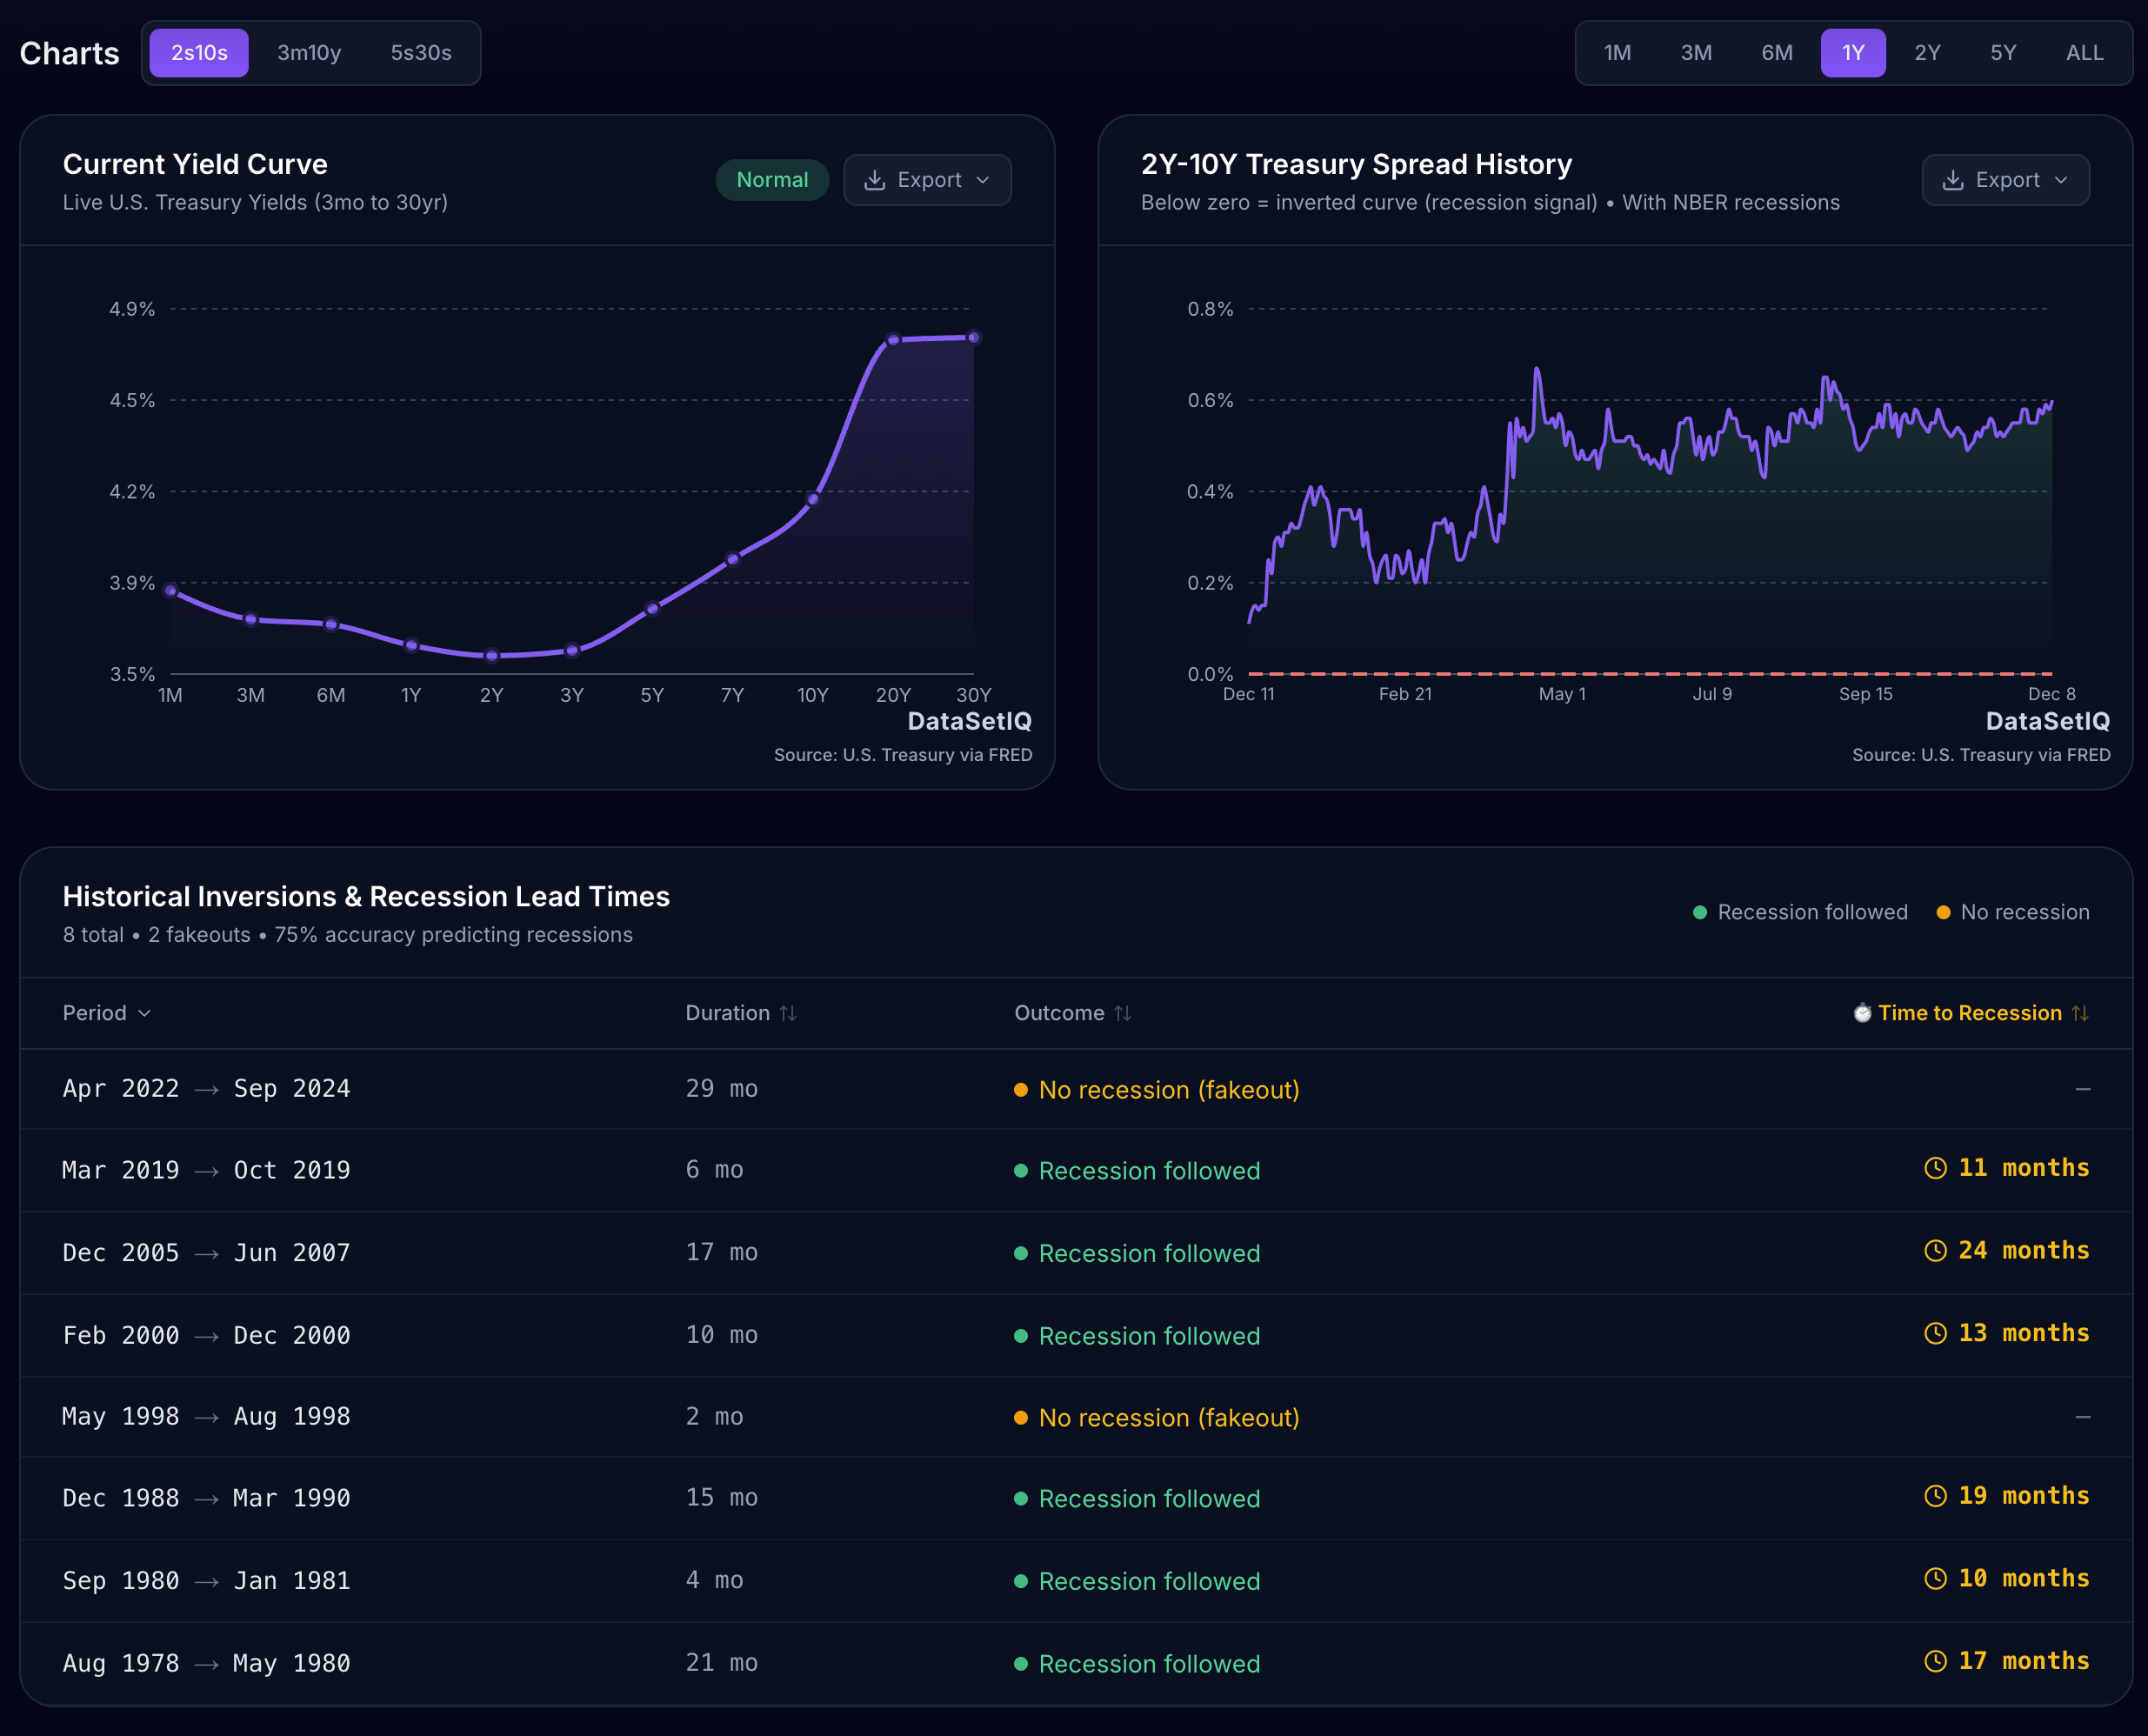
Data Source: Federal Reserve Economic Data (FRED), specifically series DGS2 and DGS10.
Tools Used: React, Recharts, and the DataSetIQ API for real-time calculations.
Methodology: I calculated the spread (10Y – 2Y) to identify inversions (negative values) and overlaid U.S. recession periods defined by NBER.
Live Interactive Version: I built a dashboard that updates this chart daily and lets you zoom into specific periods like 2008 or 2000. You can check it out here (no login/ads):https://www.datasetiq.com/tools/yield-curve-watch
Posted by dsptl
7 Comments
I honestly think economists will look back at this period as an extended recession. Its just that a typical recession is not like this one, but if you combine a more holistic understanding of indicators and exclude the outliers (the .1%), its pretty ovvious that most of the country has been in a recession since 2021 if not earlier. Its just the insane inflation and stock market skew things so much not to mention real estate, tech bubbles, energy weirdness, etc. Its more spread out so harder to track, if that makes sense.
Amazing work. The historical comparison makes the current situation a lot easier to understand.
Meh. It was inverted for a long time after Covid but no “recession”…was the signal early? Could be, YC inversions are often early and the curve usually steepens as the recession is acknowledged by the public and politicos. But a lot is different today than 1980-2019.
For starters how much fiscal stimulus was issued between 1980 and 2019 compared to 2020-2025?The globalization of supply chains started in the 90’s and was disinflationary/deflationary. We are now several years into reversing globalization.
We’ve had multiple instances of US Bonds, equities and dollar down in 2025. This was rare during 1980-2020 as the dollar often rose when US assets fell. The Eurodollar system is still intact and prevents the USD and UST’s from truly being “emerging market” but the UST yield yield curve has more in common with Brazil or Argentina than the US bond market of past decades
fed tracks uninversions to start recessions typically in about a year, not inversion. They also use 10 year – 3 month not 2 year. This indicator uninverted last year on December 17.
As they say, the inverted yield curve has predicted 10 out of the last 6 recessions
Going on year five of “95% chance of recession next year.” – 9 out of 10 of the world’s leading economists.
Just wait until the real consequences of COVID kick in.