
![[OC] Atmospheric CO₂ just hit ~428 ppm — visualizing the Keeling Curve (1958–2025) and what the acceleration really looks like](https://www.byteseu.com/wp-content/uploads/2025/12/l67t88ob3k6g1-1536x1049.png "[OC] Atmospheric CO₂ just hit ~428 ppm — visualizing the Keeling Curve (1958–2025) and what the acceleration really looks like")
👉 https://climate.portaljs.com/co2-monitoring
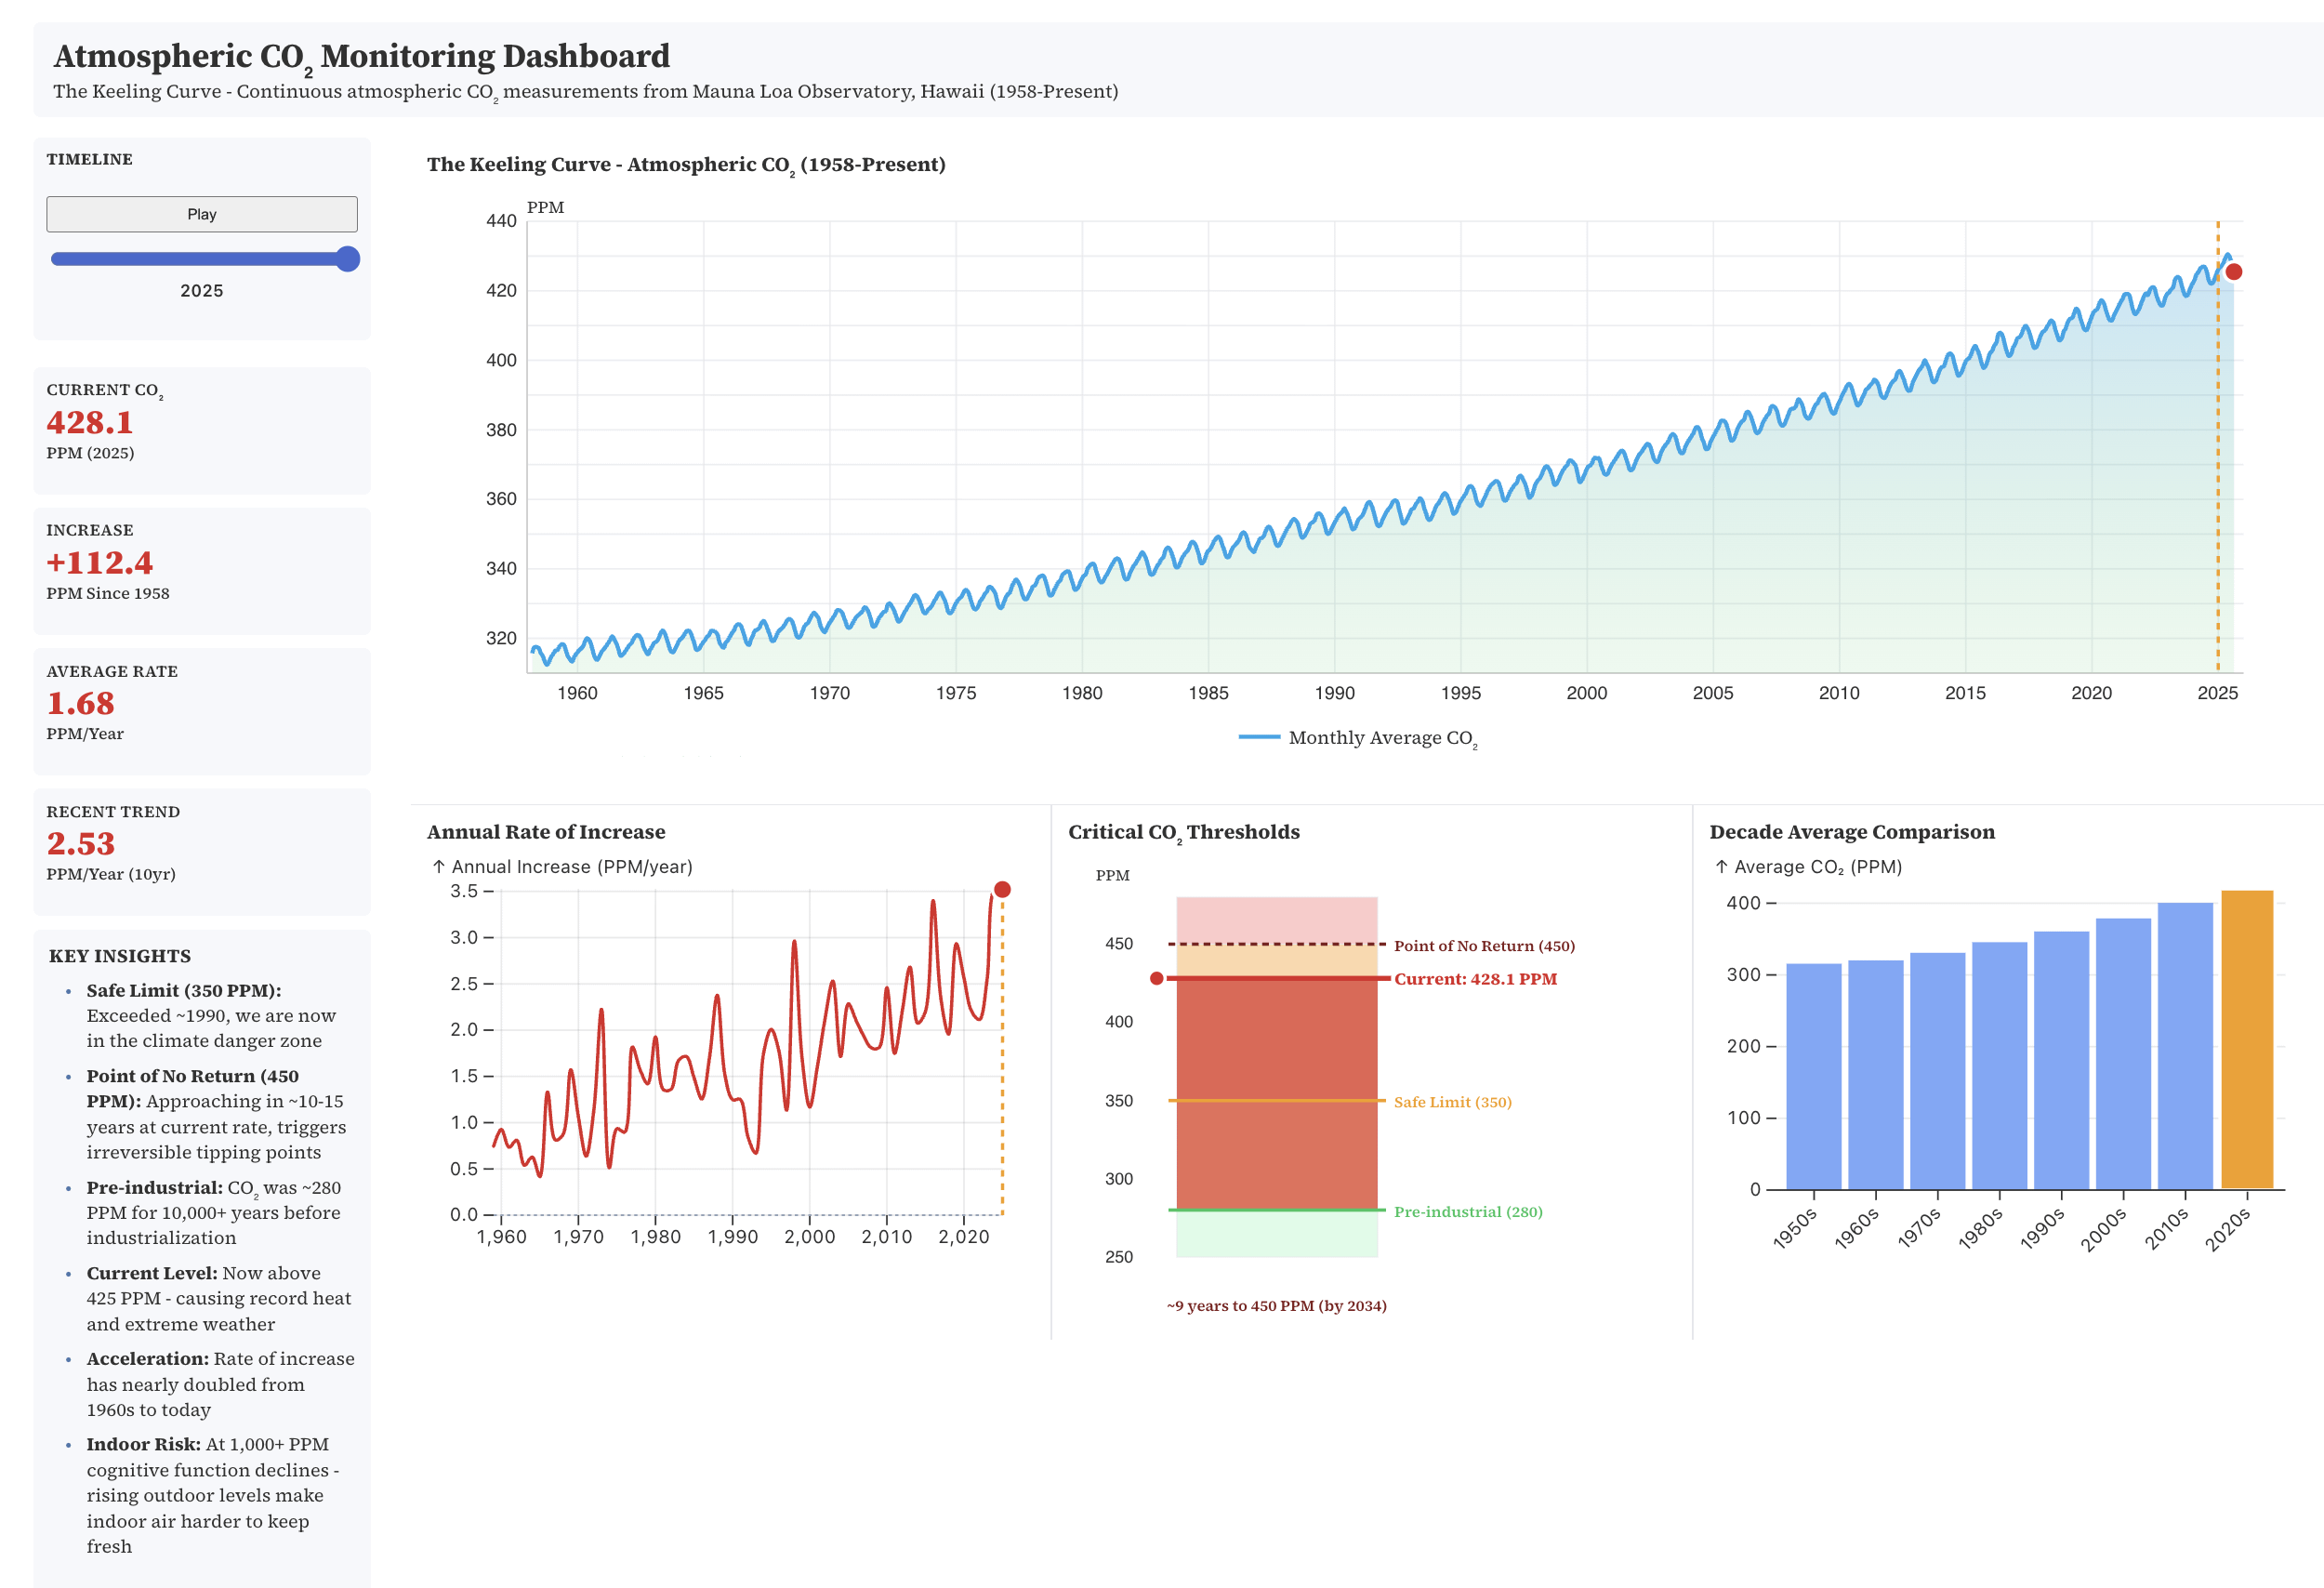
We built an interactive dashboard to make the long-term CO₂ signal impossible to ignore.
This visualizes continuous atmospheric CO₂ measurements from Mauna Loa (the Keeling Curve) from 1958 to today. A few takeaways that jump out immediately:
- CO₂ is now ~428 ppm — up ~112 ppm since measurements began
- The rate of increase is accelerating, not flattening
- 350 ppm (often cited as a “safe” upper bound) was crossed decades ago
- At current trends, 450 ppm is within roughly a decade
Posted by anuveya
11 Comments
So, in a décade ppm will have increased by 100 in my life time ?
great, I’m gonna have to recalibrate my home CO2 sensors. Also, this is fucking terrifying
what causes this saw like pattern ?
There’s a ton of sensors out there that autocalibrates to 400 “lowest value measured the last days” or so, “surely it can’t be higher”. 🙁
Why is 450PM the “point of no return” is that on about the Clathrate gun hypothesis?
CO₂ growth looks “smooth” only because we’re trained to look at levels, not rates. The moment you plot ppm/year, it stops looking like a trend and starts looking like acceleration
CO2 has been amazing for plants, hey grow faster and the world is greener than ever.
I’ve never seen years written like ‘2,025’ before lol.
So, the primary question comes to, what can each individual do to limit this change, and I don’t mean writing to corporations and politicians because relying on them to go against their bottom line is a fool’s errand. Increasing the number of plants you have in your house/apartment? Planting a certain number of trees or other plants each year? Traveling less via transport that pollutes the most? Presuming planes take the cake here. I’m also guessing aircon is a nightmare at such high quantities, but I’m no expert here, so that’s why I’m asking. Any actionable but realistic advice is more than welcome.
Can’t wait until Antractica will be a rain forest again, as it used to be.
is anybody really thinking it will change?
I’ve given up hope like 15 years ago. I mean look at that graph, we should’ve worked for a decrease for a long time now, but the increase only accelerated. We are doomed.