
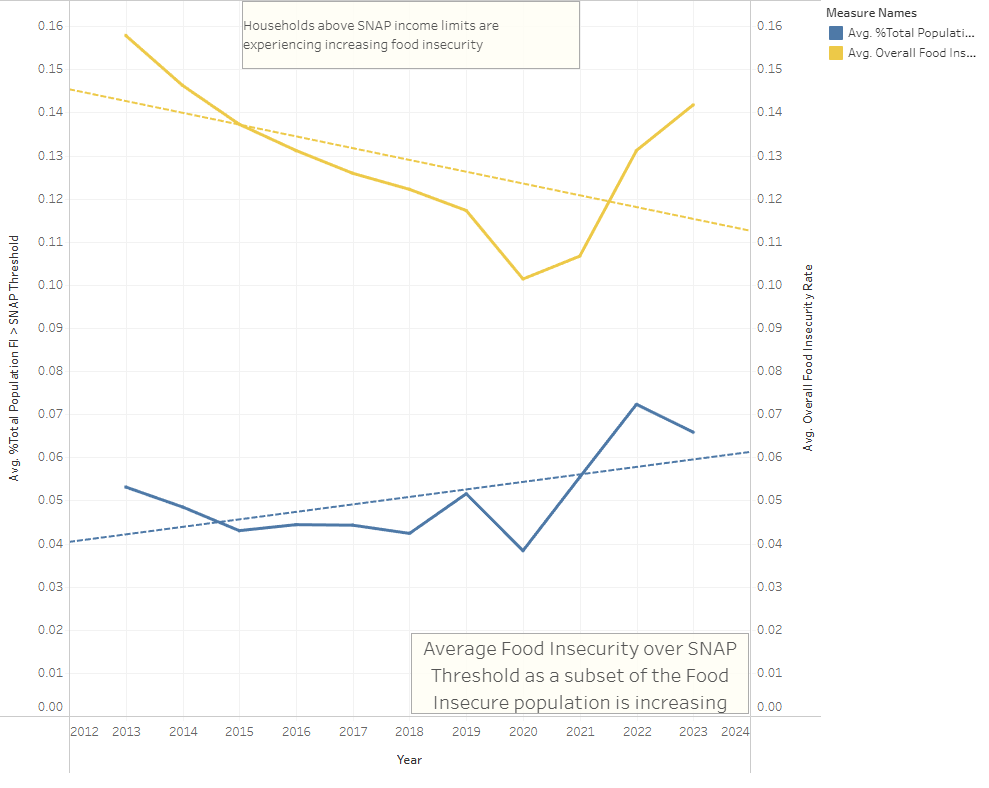
I've created a Tableau Story highlighting the effect SNAP Thresholds have on Food Insecurity, and how while food insecurity rates are on the decline as a trend, it appears that Food Insecurity for those above SNAP thresholds appears to be increasing.
I used data from Feeding America to build this, as well as data from the Federal Reserve Bank to add some visuals related to Real Median Household Income.
I also used Knime for ETL when preparing some of the data.
Posted by __haste__
2 Comments
I am using data from [Feeding America](https://www.feedingamerica.org/) and the [Federal Reserve Bank](https://fred.stlouisfed.org/series/MEHOINUSA672N)
Data from Feeding America needs to be requested from the organization as far as I am aware.
I’m always weirded out by data that shows pills more smoothly and population data.
One is a poll.and the other is a sample from hard data.