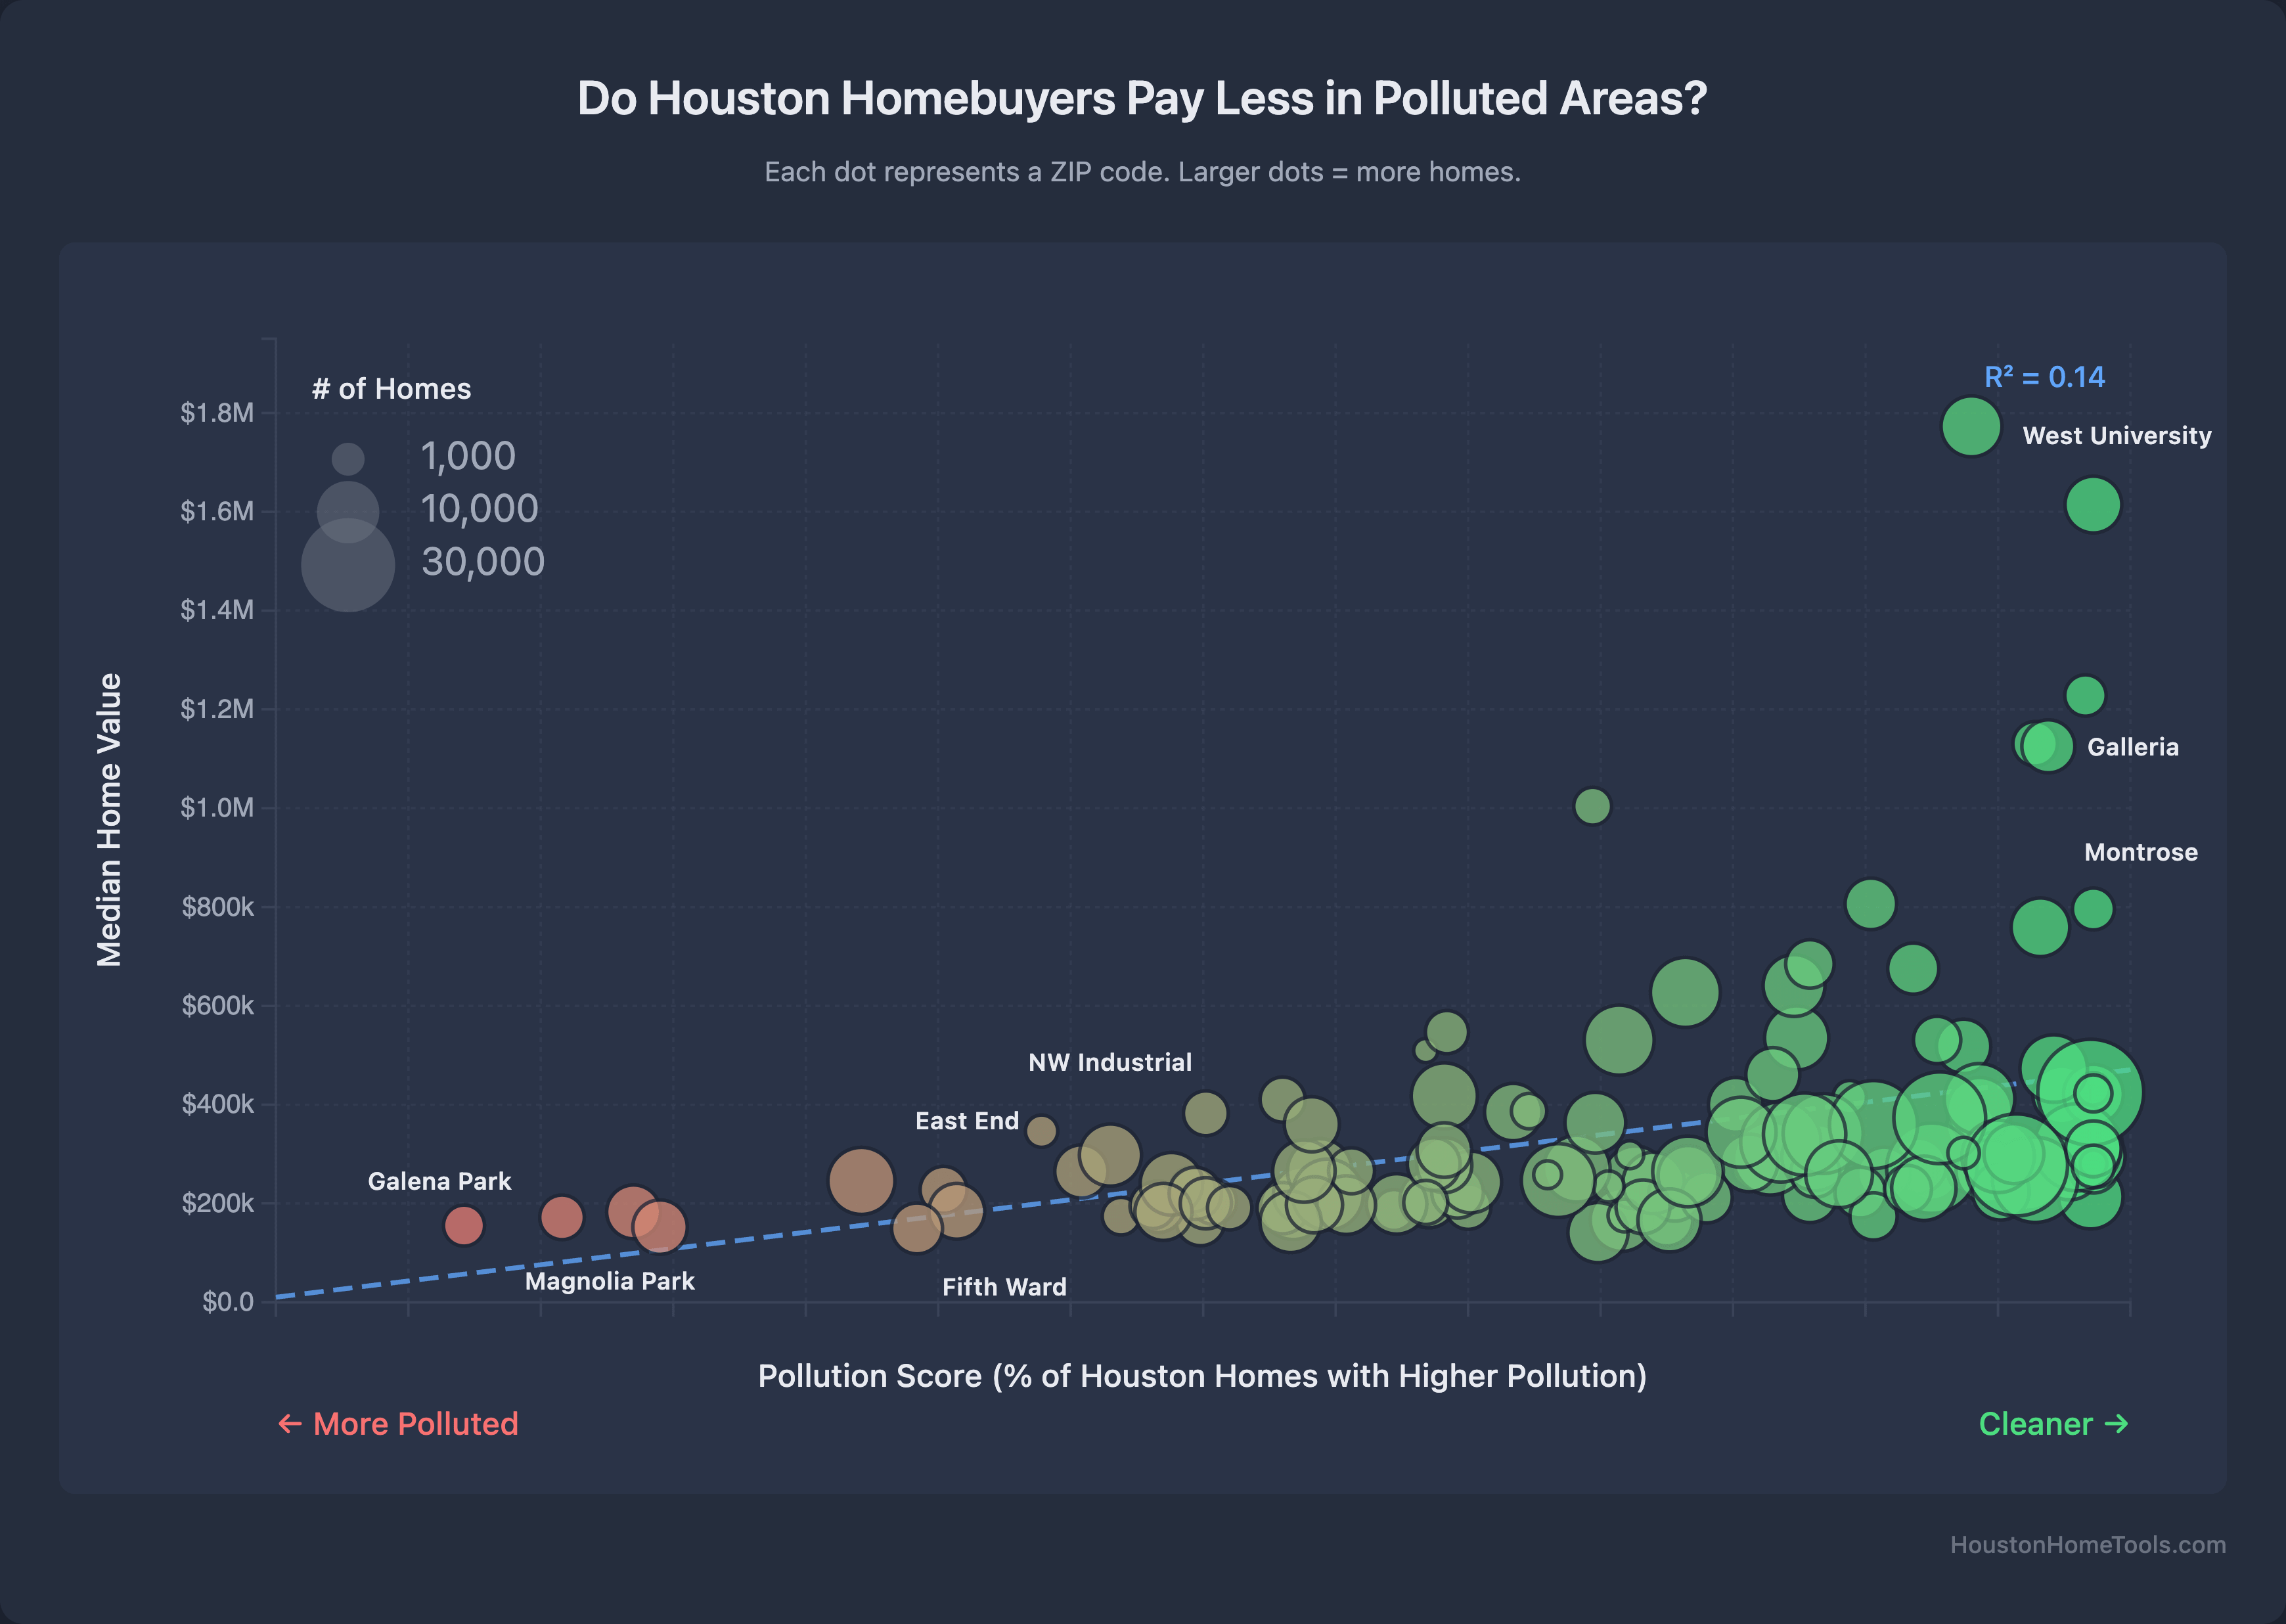
Looks like a good illustration of why linear regressions are not appropriate to all situations. (Probably also a cautionary tale about insisting a linear regression pass through the origin, too.)
An x-axis labelled as a ‘score’ (or a percentile…?) without any numbers is an unfortunate omission. (It’s also awkward to have neighborhood names that are not clearly tied to specific points.)

![[OC] Pollution levels vs. Home Values across 150+ Houston ZIP codes](https://www.byteseu.com/wp-content/uploads/2025/12/zrlirlb1dz6g1-1536x1091.png "[OC] Pollution levels vs. Home Values across 150+ Houston ZIP codes")
2 Comments
Data: Harris County Appraisal District, EPA environmental data
Tool: JavaScript / D3.js
Interactive version: [https://houstonhometools.com/insights/pollution-property-values/](https://houstonhometools.com/insights/pollution-property-values/)
Looks like a good illustration of why linear regressions are not appropriate to all situations. (Probably also a cautionary tale about insisting a linear regression pass through the origin, too.)
An x-axis labelled as a ‘score’ (or a percentile…?) without any numbers is an unfortunate omission. (It’s also awkward to have neighborhood names that are not clearly tied to specific points.)