
![[OC] How Microsoft Turned $77.7B in Revenue into $27.7B Profit in Q1 FY26](https://www.byteseu.com/wp-content/uploads/2025/12/t0o4z5ojqc8g1-1536x960.png "[OC] How Microsoft Turned $77.7B in Revenue into $27.7B Profit in Q1 FY26")
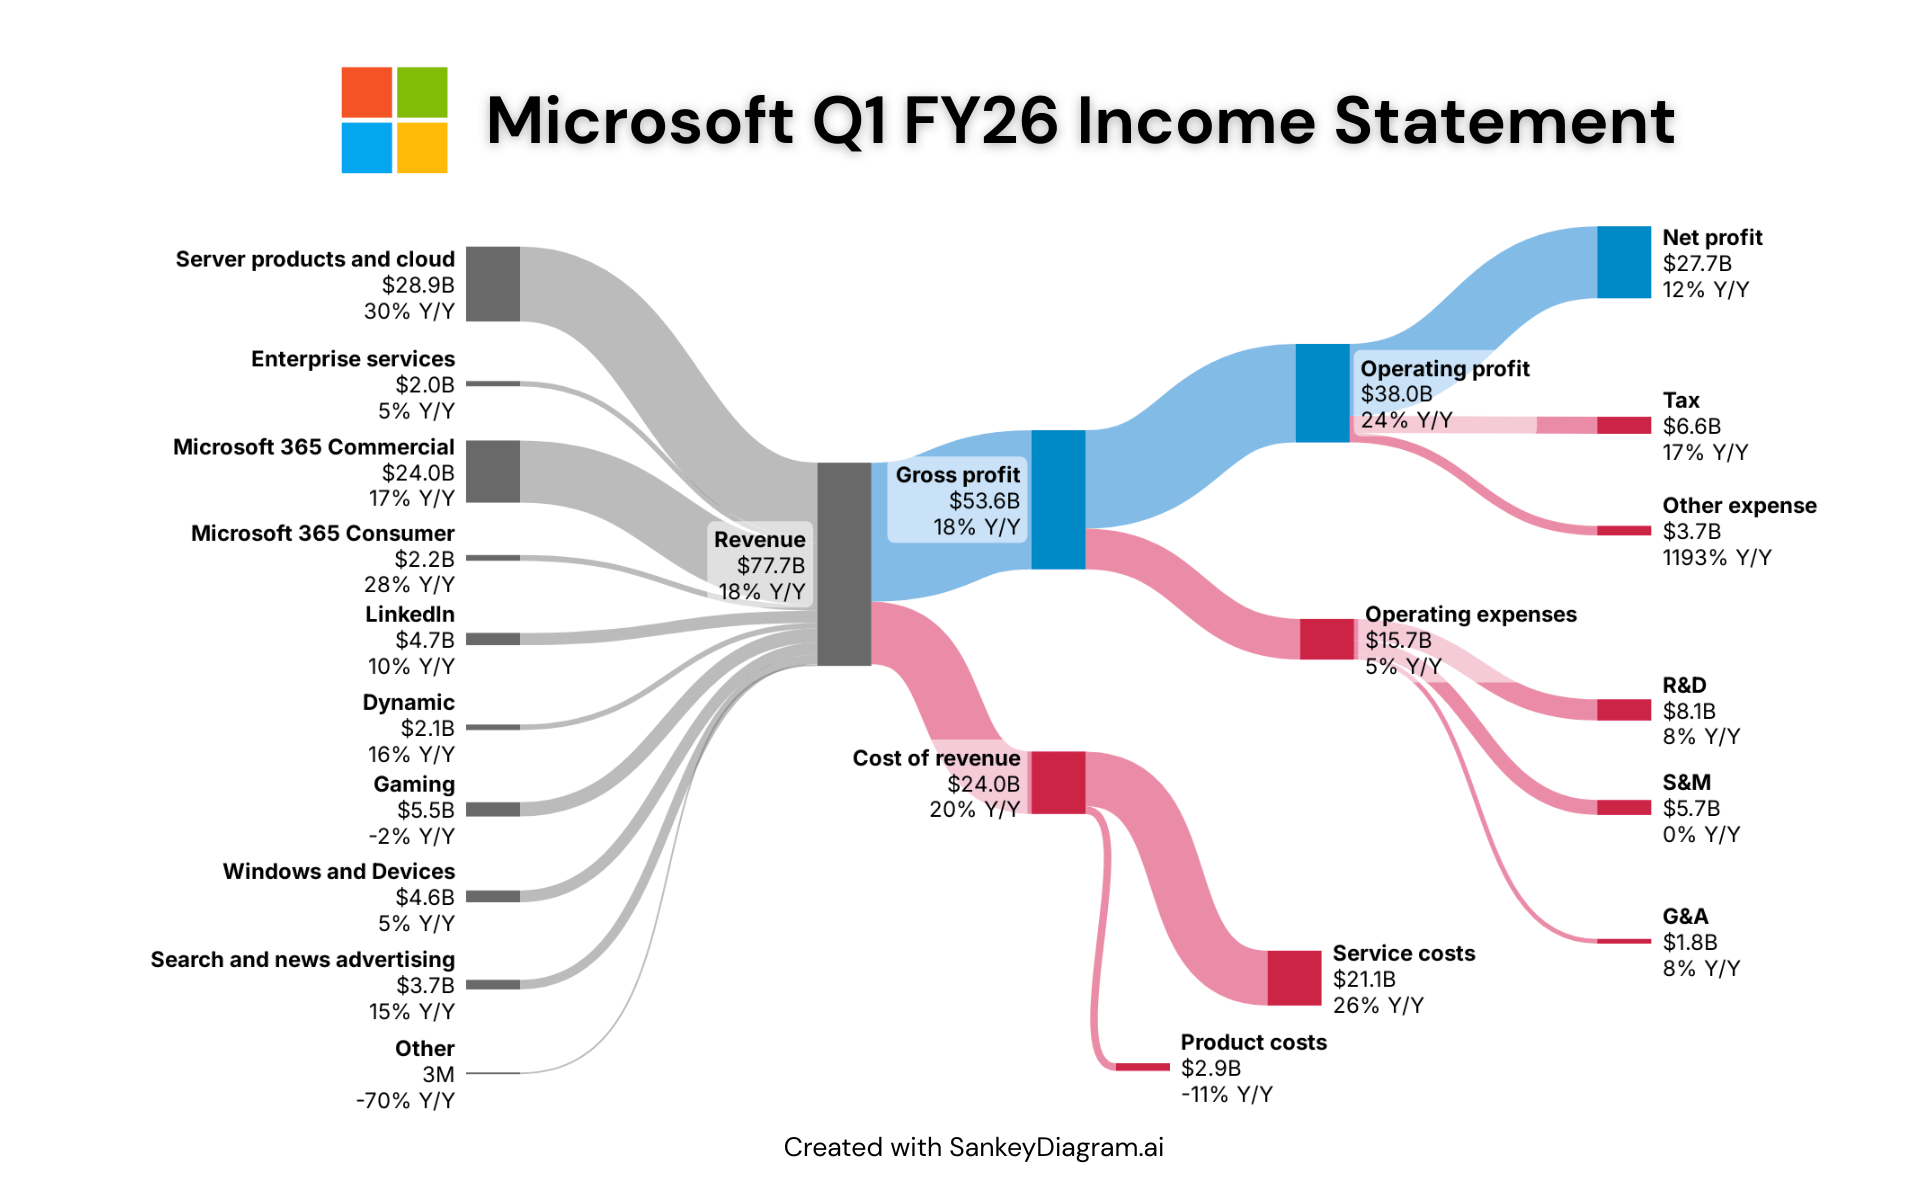
This Sankey diagram visualizes Microsoft’s Q1 FY26 income statement, showing how the company generated $77.7B in total revenue and how it flowed through costs and operating expenses to produce $27.7B in net profit.
Highlights from Q1 FY26:
- Server products and cloud services remain the largest revenue driver, growing 30% year over year
- Microsoft 365 Commercial and LinkedIn continue steady growth
- Gross profit reached $53.6B, up 18% YoY
- Operating profit increased to $38.0B, up 24% YoY
- Net profit rose 12% YoY, despite higher operating expenses
Made with: SankeyDiagram + Canva Tool
Source: Microsoft Q1 FY26 Earnings Report / Investor Relations
Posted by FrostingTall9171
6 Comments
Which one shows how much Altman siphoned?
Weird how AI isn’t listed? I’d assume, given how important and awesome everyone says it is, that they would want is to know how much money it is making them.
How the hell does linkedin make 4.7B
For context, when the US government sued Microsoft for antitrust 30 years ago, it was for Microsoft’s dominance in operating systems (Windows) and applications (Office). They were roughly equal in size.
Today, the closest equivalents would be the “Windows and Devices” and “Microsoft 365” tranches. ***Everything else*** did not exist back then, or in very, very tiny slivers (such as gaming). Yes, that entire “Server products and cloud” tranche is entirely a product of the past 20 years.
NB – “Dynamics” is misspelled.
It’s beyond me how they could mess up the whole Gaming devision, they made huge investments and yet fumbles with the Xbox hardware and gaming studios.
$27B profit on $77B revenue, wow. What will be their excuse whe they fire another 8000 employees?