
![[OC] 70,000 images of clothes sorted by visual similarity into a 3D point cloud](https://www.byteseu.com/wp-content/uploads/2025/12/9za54aqnwe8g1-1024x714.gif "[OC] 70,000 images of clothes sorted by visual similarity into a 3D point cloud")
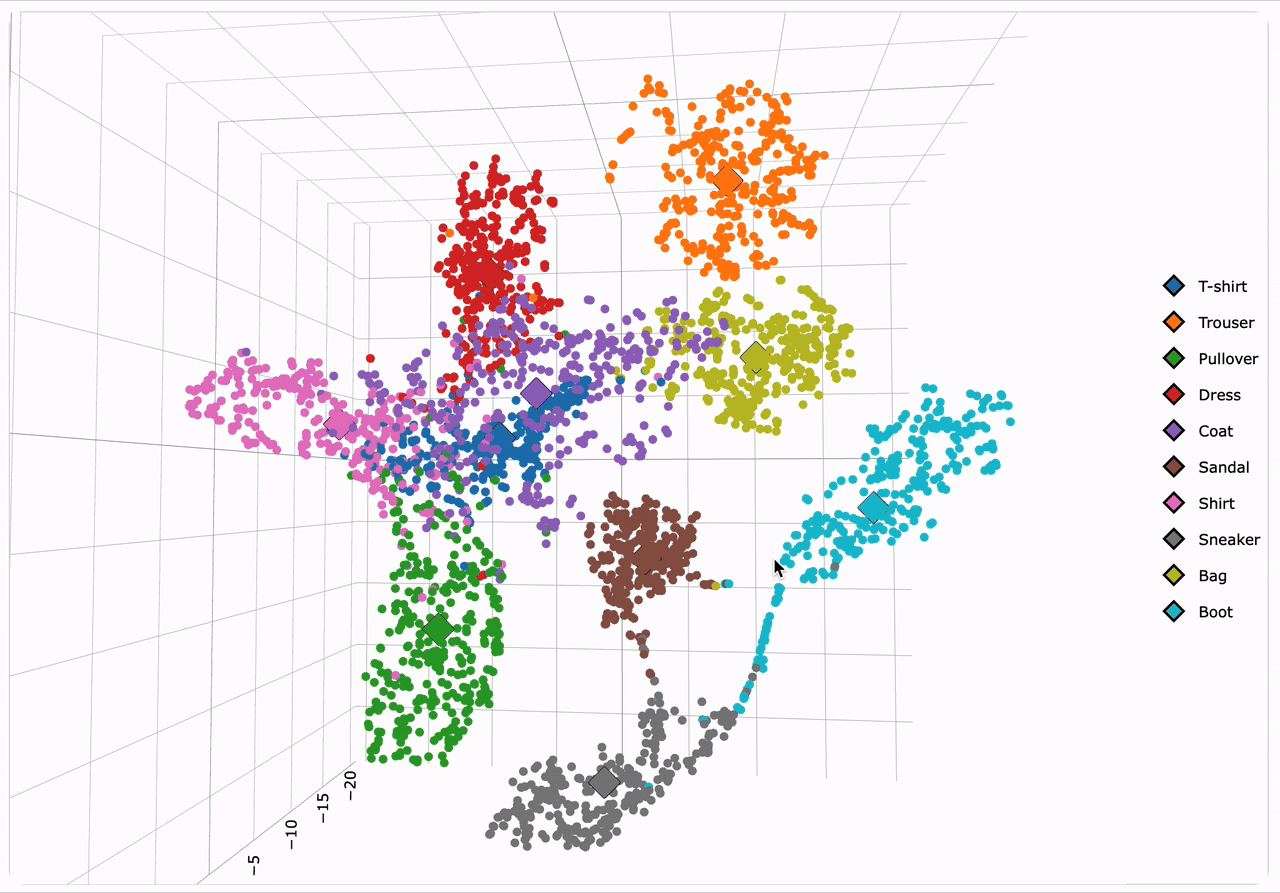
This visualization represents the Fashion-MNIST dataset, which consists of 70,000 grayscale images across 10 distinct clothing categories (T-shirts, trousers, sneakers, etc.).
I trained a Convolutional Neural Network (CNN) to recognize these items. Instead of just looking at the final classification, I extracted the internal 512-dimensional vector produced by the convolution layers. This vector represents the "features" the AI sees.
To visualize this, I used dimensionality reduction algorithms (t-SNE and UMAP) to project those 512 dimensions down into a 3D cloud. The result is that items the AI finds visually similar drift together, creating natural clusters.
It’s interesting to see how the classes corresponding to Shirt, T-shirt, Pullover, and Coat form overlapping clusters in the latent space due to their visual similarity, whereas footwear classes such as Sneaker and Boot form distinct, dense clusters that are well separated. High-cut sneakers and some boots lie between the two clusters, forming a transition zone.
Take a look at it here: bulovic.at/fmnist
^Reposting because I didn’t include the source and tools last time.
Posted by BeginningDept
13 Comments
Visualization Tool: plotly. Data Source: Fashion-MNIST. Analysis: python.
this is beautiful! had no idea you could make 3D graph w/ plotly!
Now this is beautiful data
dude, didn’t you post this like yesterday?
Is this the dataset Sheldon and Penny were creating in that one episode to develop an app to identify shoes?
Why does it look like Fr*nce
Also damn that’s awesome.
Given how distinct the clusters are, I wonder if you could achieve the same level of performance with much higher efficiency with a CNN that uses only a 3-dimensional vector.
Me and gemini are discussing in depth your post
We looked at a visualization of a Convolutional Neural Network (CNN) trained on the Fashion-MNIST dataset.
The Process: The AI takes an image of clothing, processes it through layers to detect edges/textures, and converts it into a 512-dimensional vector (an embedding).
The Visualization: Using t-SNE, these 512 dimensions are projected into 3D space. The result is “clouds” of data where all Trousers cluster together and all Sandals cluster together, proving the AI understands the categories.
The “Crystal” Metaphor: We discussed how the data points form a “crystalline structure.”
The Insight: This is a perfect metaphor for Linear Algebra. Each image is a Vector (a line shooting from zero).
The Structure: The “lines” connecting them are the mathematical relationships (angles and distances) that hold each data point in its specific place relative to the others. The “crystal” is the rigid mathematical logic (manifold) the AI has learned to separate the items
I’m just venturing into ai and have had at most a basic understanding of calculus…
Right now I’m working through in my mind how vectors can create crystal shapes versus golf course putting green shapes, and how they are the same and different. Since i can’t post a direct link to my discussion with gemini, as it includes a Google link shortner, I’d love to dm it you so you can see my nuanced conversation…
Ty so much for the graph
I actually think this is VERY cool. Imagine looking for a type of shoes online and being offered all those that really look like it, it’s save so much time and effort.
I dont think my closet is that crowded. But getting there.
You are a saint for sharing the source. Amazing 😍
What a surprise. Clothes for a handful body parts can be clustered in a handful clusters. Lol
https://preview.redd.it/x5so2ghqsf8g1.jpeg?width=434&format=pjpg&auto=webp&s=5a639e32a2fb688dfdddecb730d2f814e3d48040
Strange bag