

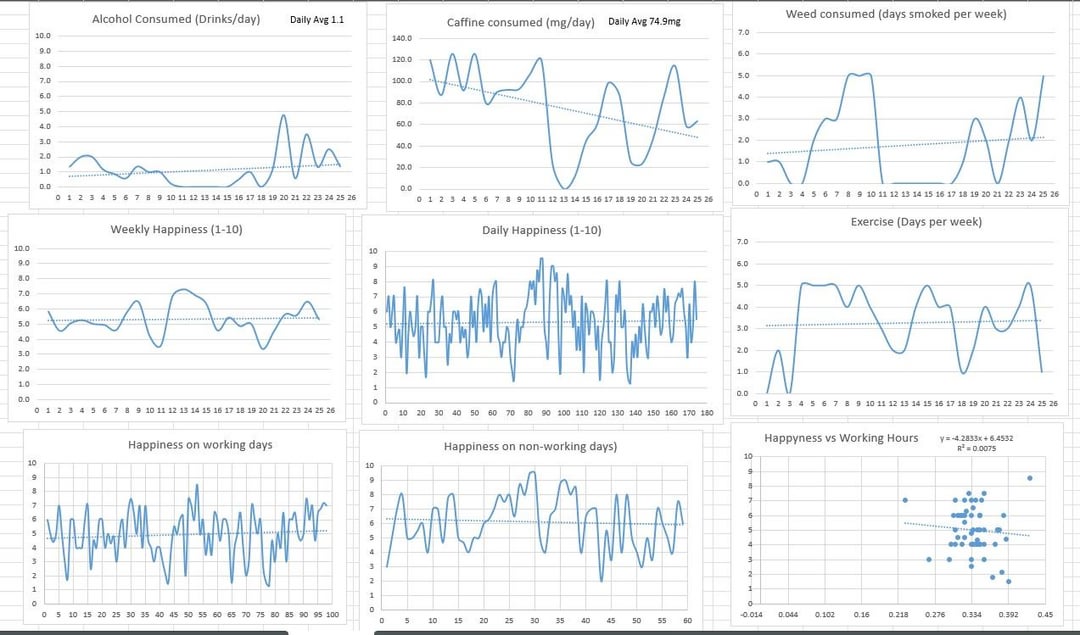
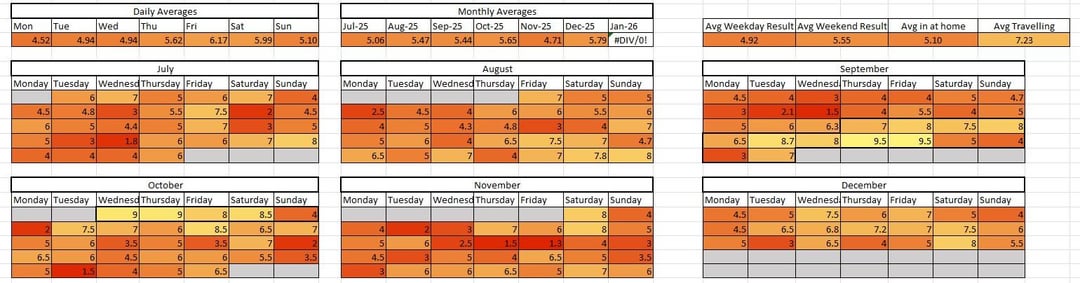
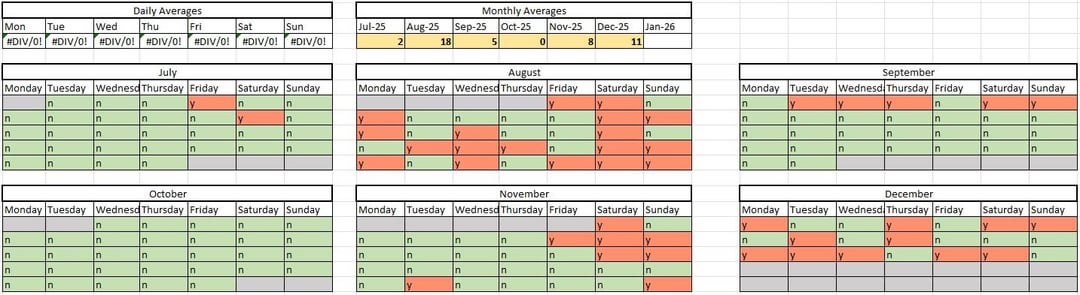
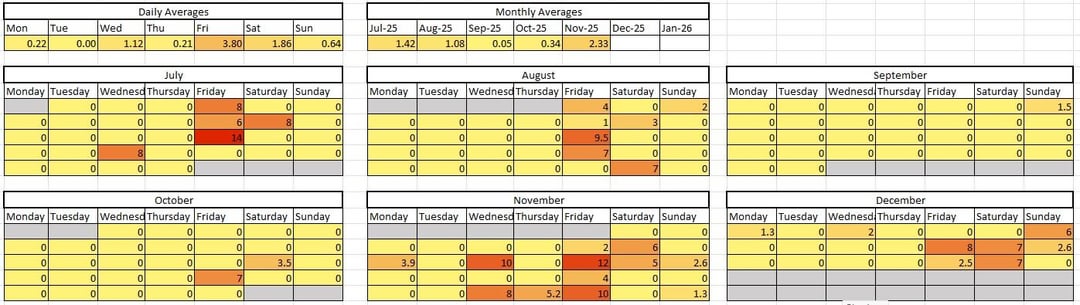
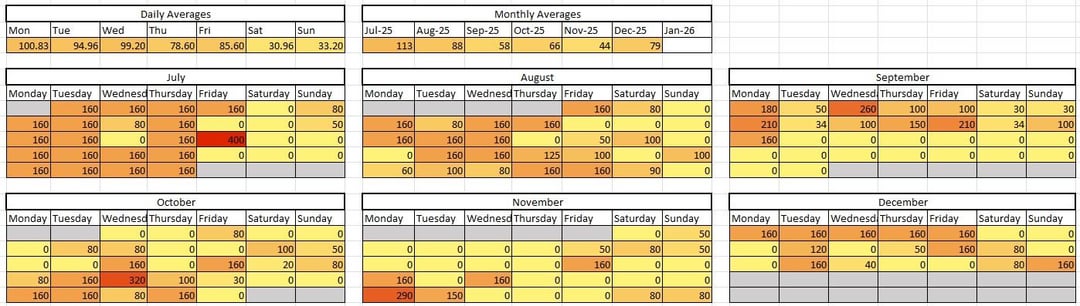
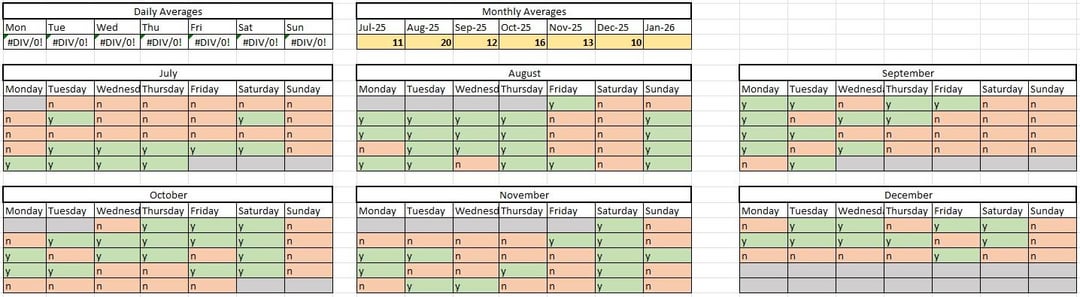
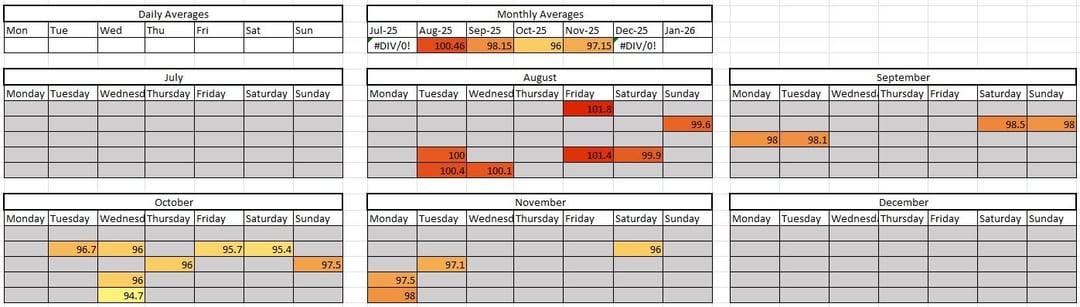
In order of left to right: Data summary, happiness, weed consumption, alcohol consumption, caffeine consumption, exercise, weight.
I’ve spent 6 months analysing different aspects of my life including happiness, time spent at work, exercise and substance consumption in order to compile charts to show what is actually making me happy long term and how different things affect me.
I’m happy to answer any comments and discussions conclusions that anyone draws from this data, enjoy!
Posted by DeepFriedDave69
4 Comments
Give us the fun data like how many poops a day and how often you beat your meat per week.
Thanks. Feedback you didn’t ask for: put a title on every picture. Explain a bit more about the reasons and the graphs
I don’t know how much sense it makes to connect every data point with a graph. Because what you mean by this is that you are measuring something continuous and that for every second in between there is a fitting value. Especially on graphs like “workouts per week” you should ask yourself that.
What did you use for tracking? apps or just sheets? What made you stay consistent in tracking it?