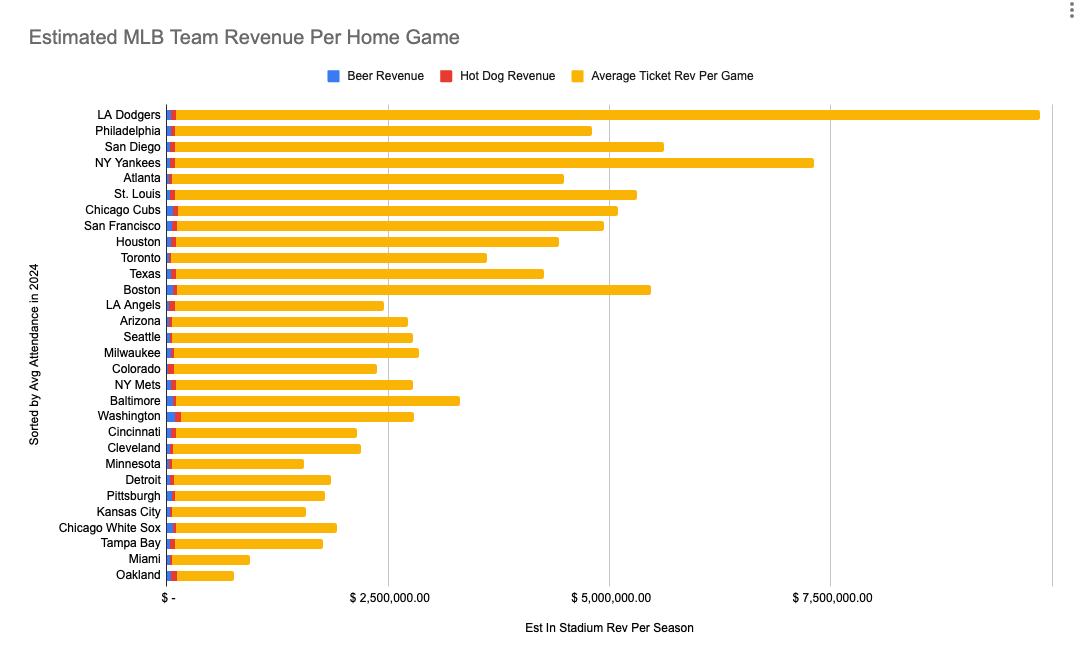
I put this together because I was arguing with some friends this week (over beers) that the majority of MLB teams make at least $5M+ per game. They said way lower, maybe $1M per game. I’m seeing the average is $3M+ per game.
I am missing a whole lot of metrics – Parking, Food Sales, Merchandise Sales, e.g… – but I looked at Avg Ticket Price, Avg Beer Price, and Avg Hot Dog price to provide rough estimates, and it gave us some clarity. The Y Axis is sorted by average attendance, as I think it’s interesting to see that Philadelphia is doing better with atendance per game than San Diego, but making less money because of the lower face value avg ticket price.
May post this in r/baseball but first sharing here!
BurningSquid on
Great idea! I think it would be easier to interpret if the bars were sorted
Edit: if you want to see the relationship between attendance and revenue I’d do a crossplot

![[OC] Estimated MLB Team Revenue Per Home Game - Settling an Argument](https://www.byteseu.com/wp-content/uploads/2024/06/nc6kvcv2sr4d1-1024x614.png "[OC] Estimated MLB Team Revenue Per Home Game – Settling an Argument")
2 Comments
Source: Here is the data I used, organized, with the help of ChatGPT – [https://docs.google.com/spreadsheets/d/1r13wkG4wMHsBoNMPQLPh8dZ50O0POL92MPsLTTHkYvg/edit#gid=0](https://docs.google.com/spreadsheets/d/1r13wkG4wMHsBoNMPQLPh8dZ50O0POL92MPsLTTHkYvg/edit#gid=0)
Tool for Viz: Google Sheets
I put this together because I was arguing with some friends this week (over beers) that the majority of MLB teams make at least $5M+ per game. They said way lower, maybe $1M per game. I’m seeing the average is $3M+ per game.
I am missing a whole lot of metrics – Parking, Food Sales, Merchandise Sales, e.g… – but I looked at Avg Ticket Price, Avg Beer Price, and Avg Hot Dog price to provide rough estimates, and it gave us some clarity. The Y Axis is sorted by average attendance, as I think it’s interesting to see that Philadelphia is doing better with atendance per game than San Diego, but making less money because of the lower face value avg ticket price.
May post this in r/baseball but first sharing here!
Great idea! I think it would be easier to interpret if the bars were sorted
Edit: if you want to see the relationship between attendance and revenue I’d do a crossplot