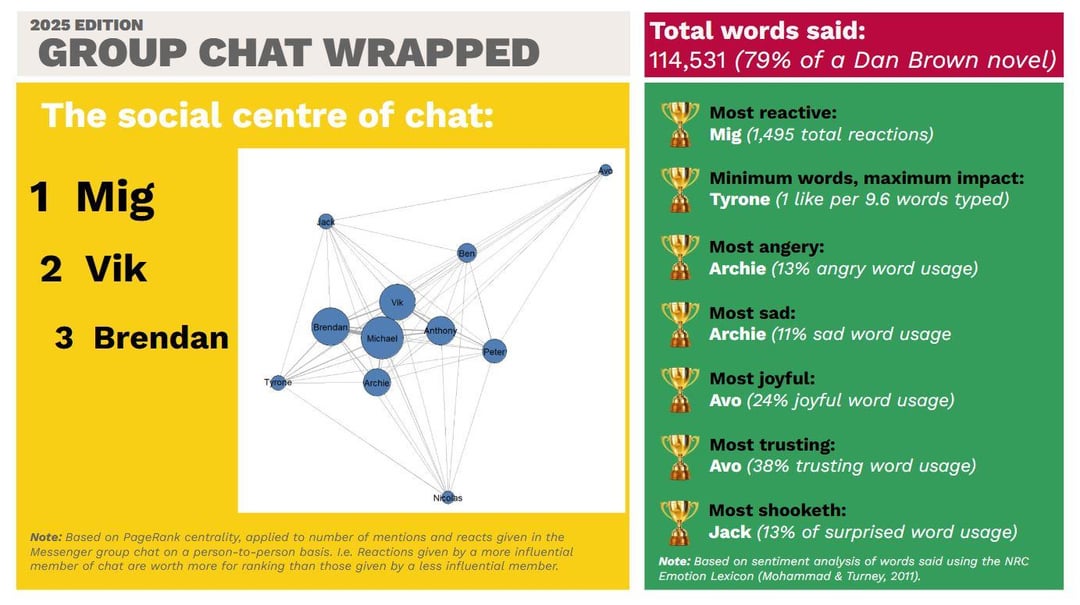
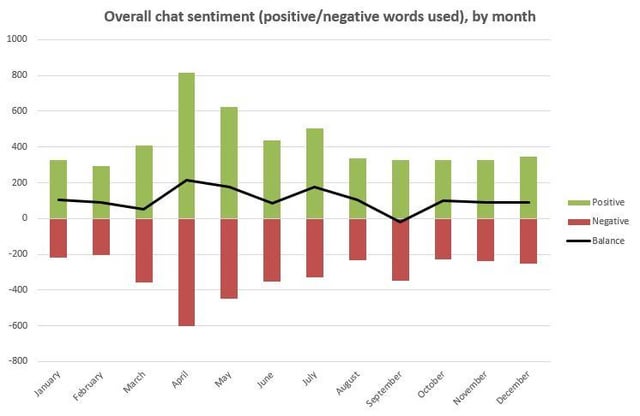
[OC] This year’s annual ‘Group Chat Wrapped’ of my friend group’s Messenger chat (uses PageRank algorithm and sentiment analysis lexicons)
Posted by plime97

![[OC] This year's annual 'Group Chat Wrapped' of my friend group's Messenger chat (uses PageRank algorithm and sentiment analysis lexicons)](https://www.byteseu.com/wp-content/uploads/2025/12/fo0tcwp2bp8g1-1024x574.jpg "[OC] This year’s annual ‘Group Chat Wrapped’ of my friend group’s Messenger chat (uses PageRank algorithm and sentiment analysis lexicons)")
[OC] This year’s annual ‘Group Chat Wrapped’ of my friend group’s Messenger chat (uses PageRank algorithm and sentiment analysis lexicons)
Posted by plime97
1 Comment
Tool used: R packages – tidytext, igraph (for the network visualisation), textdata (for sentiment analysis).
The presentation of the results was in Google Slides because I got lazy!
I posted the code and a little how-to last year – for anyone else who wants to cause chaos in their friend groups:
[https://github.com/plime97/group_chat_wrapped](https://github.com/plime97/group_chat_wrapped)