
![[OC] 📺 How viewers drop off as a TV/web series progresses (US)](https://www.byteseu.com/wp-content/uploads/2025/12/hu3xrm2fea9g1-1536x874.png "[OC] 📺 How viewers drop off as a TV/web series progresses (US)")
Merry Christmas! 🎅 🎄 'Tis the season of OTT binges/marathons.
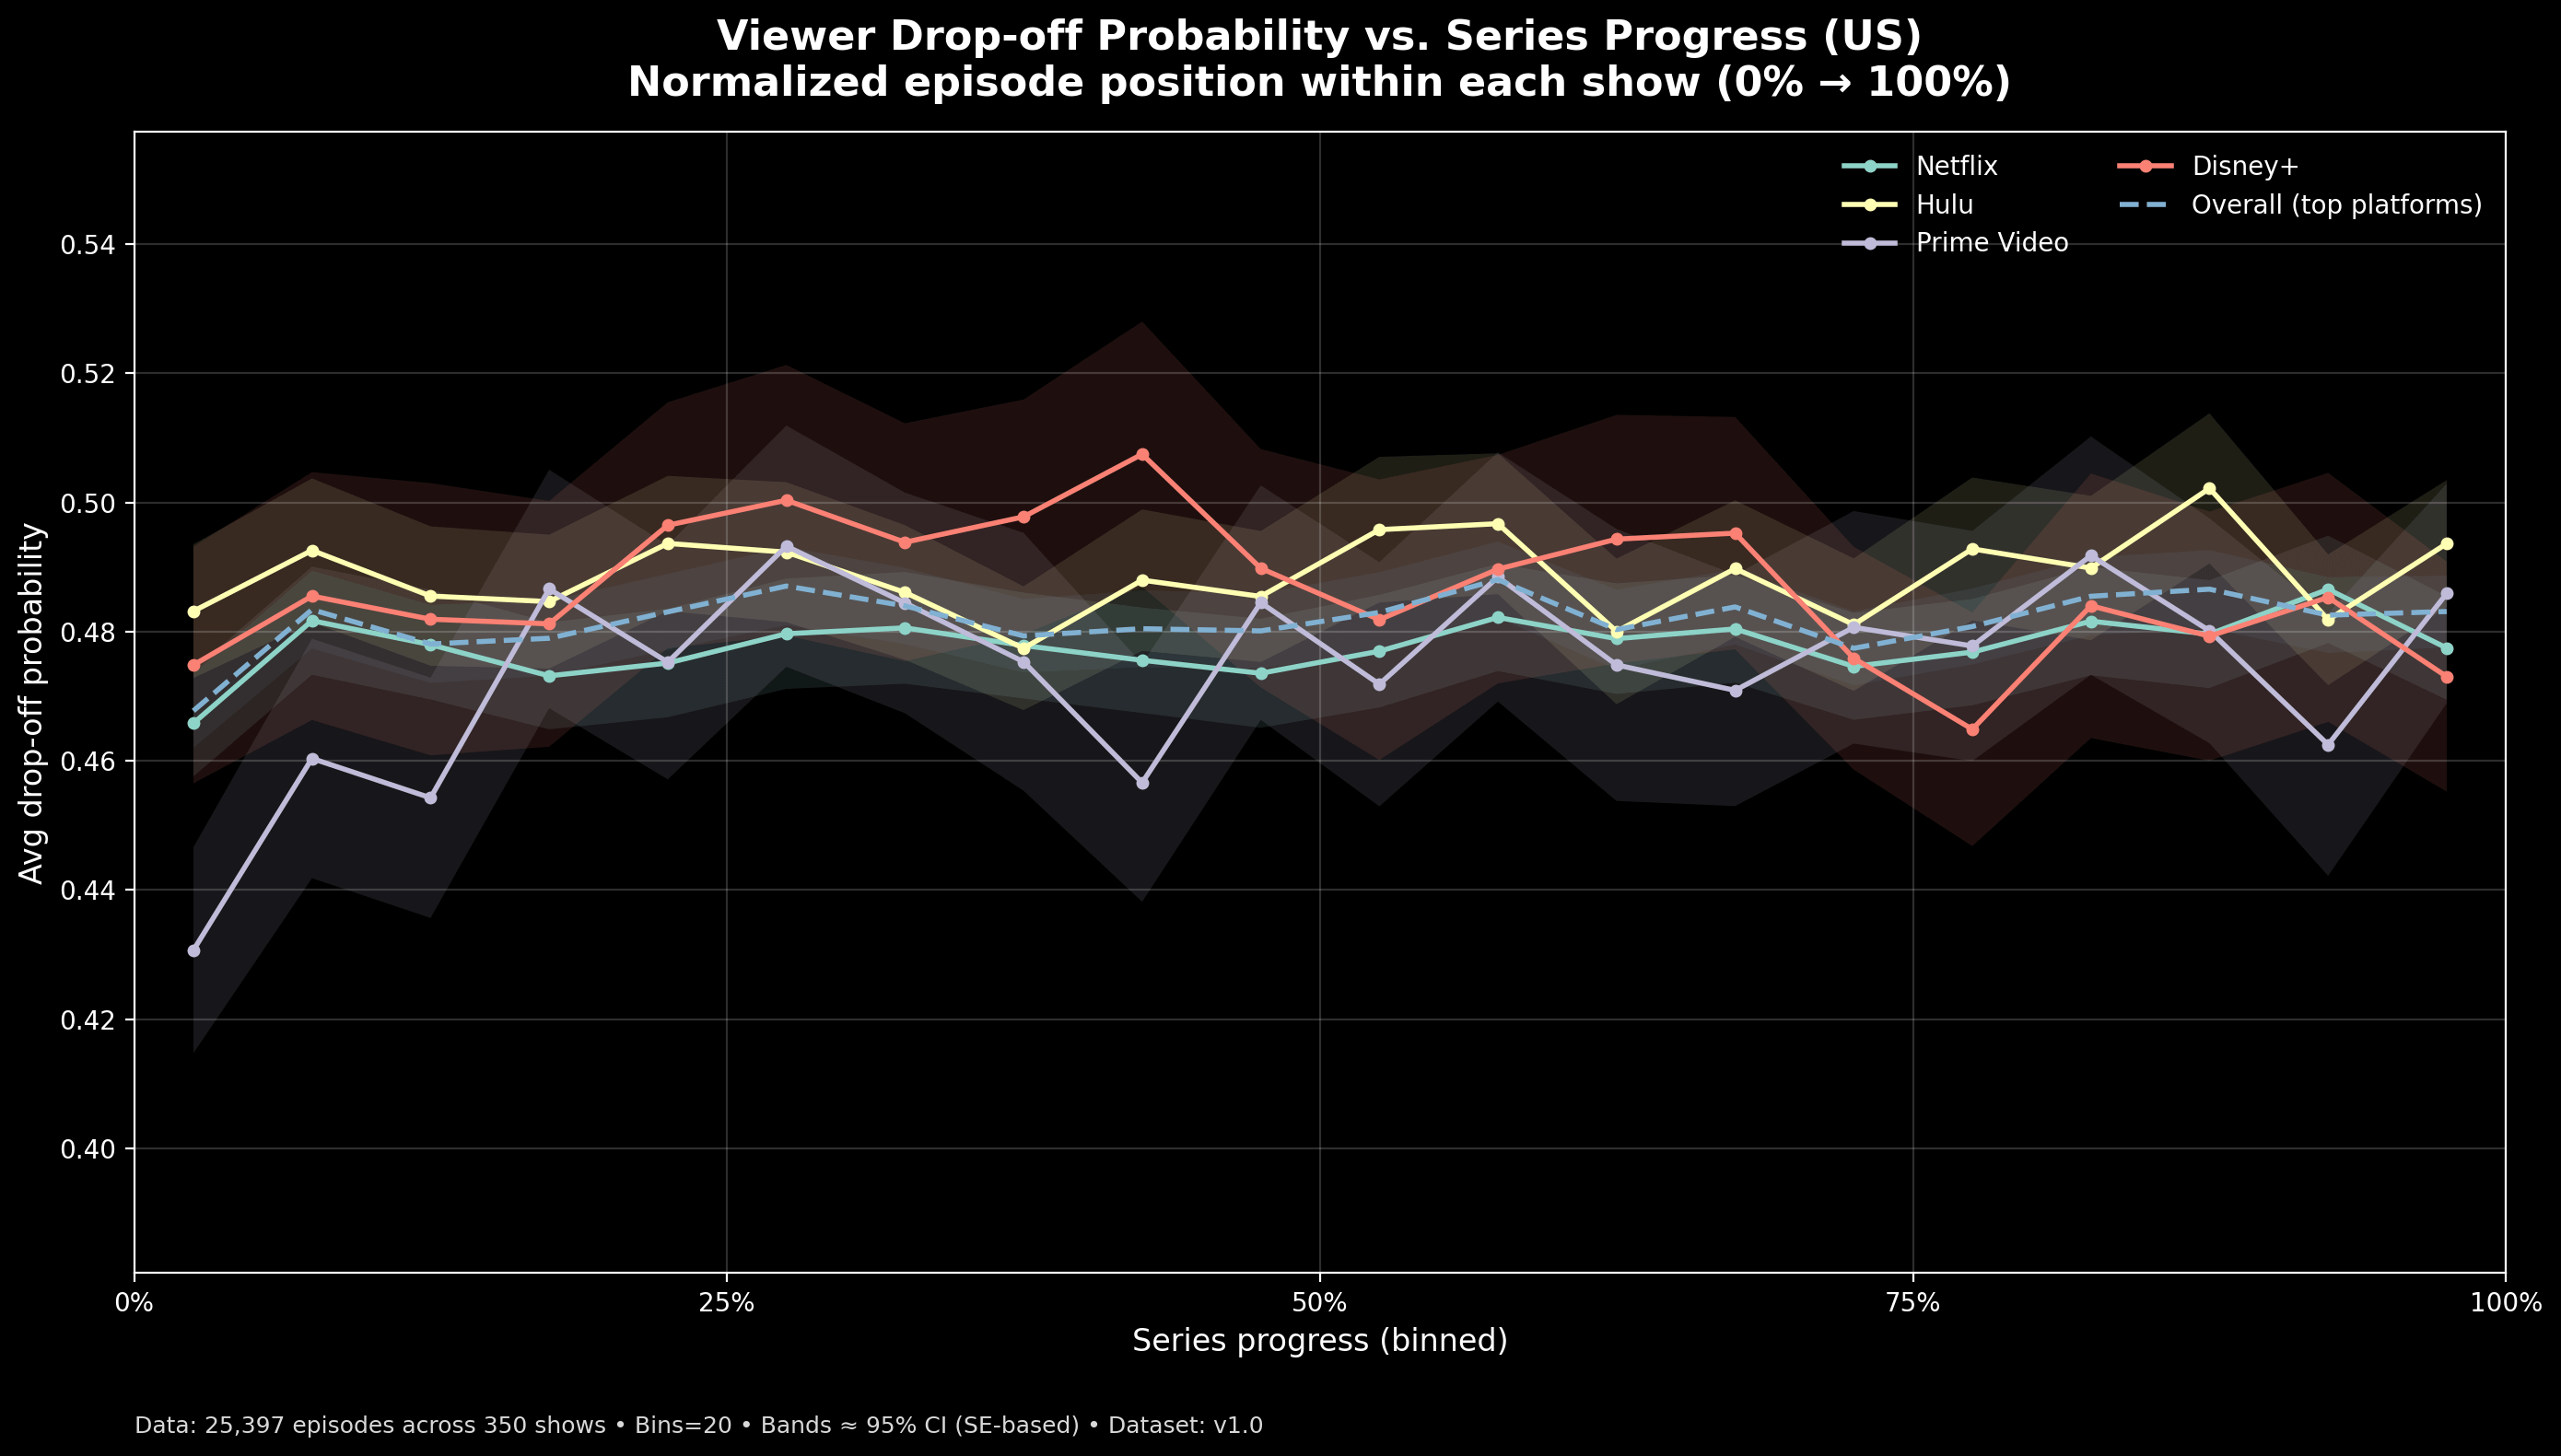
TL;DR: When TV shows are normalized by progress instead of episode number, viewer drop-off follows a similar early-dip / mid-plateau / late-rise pattern across platforms — with meaningful uncertainty.
The chart shows viewer drop-off across a TV series, measured by where you are in the show rather than by episode number.
Each series is normalized from:
- 0% → first episode
- 100% → final episode ('final' here refers to last episode available for a given show in the dataset)
Episodes are grouped into 20 progress bins, and the average drop-off probability is computed within each bin. Lines represent the four most common streaming platforms in this dataset (Netflix, Hulu, Prime Video, Disney+). Shaded regions show ~95% confidence intervals (standard error-based).
Why normalize?
Because episode 5 means very different things in a 6-episode miniseries versus a 30-episode procedural. Normalization lets us compare patterns of viewer behavior, not catalog length.
What stands out:
- Early-series churn (“pilot cliff”) appears across platforms.
- Mid-series stability varies.
- Drop-off often rises again near finales, suggesting selective completion rather than universal binge-through.
Important note:
This chart is not being a grinch – saying Platform X is “better” or “worse.” It reflects episode-level behavior in this dataset only. Episodes within the same show are correlated, and the confidence bands indicate estimate stability — not causal differences or platform quality judgments.
Data 📊: https://www.kaggle.com/datasets/eklavya16/ott-viewer-drop-off-and-retention-risk-dataset
Made using ⚒️: pandas + numpy + Matplotlib
Posted by VegetableSense