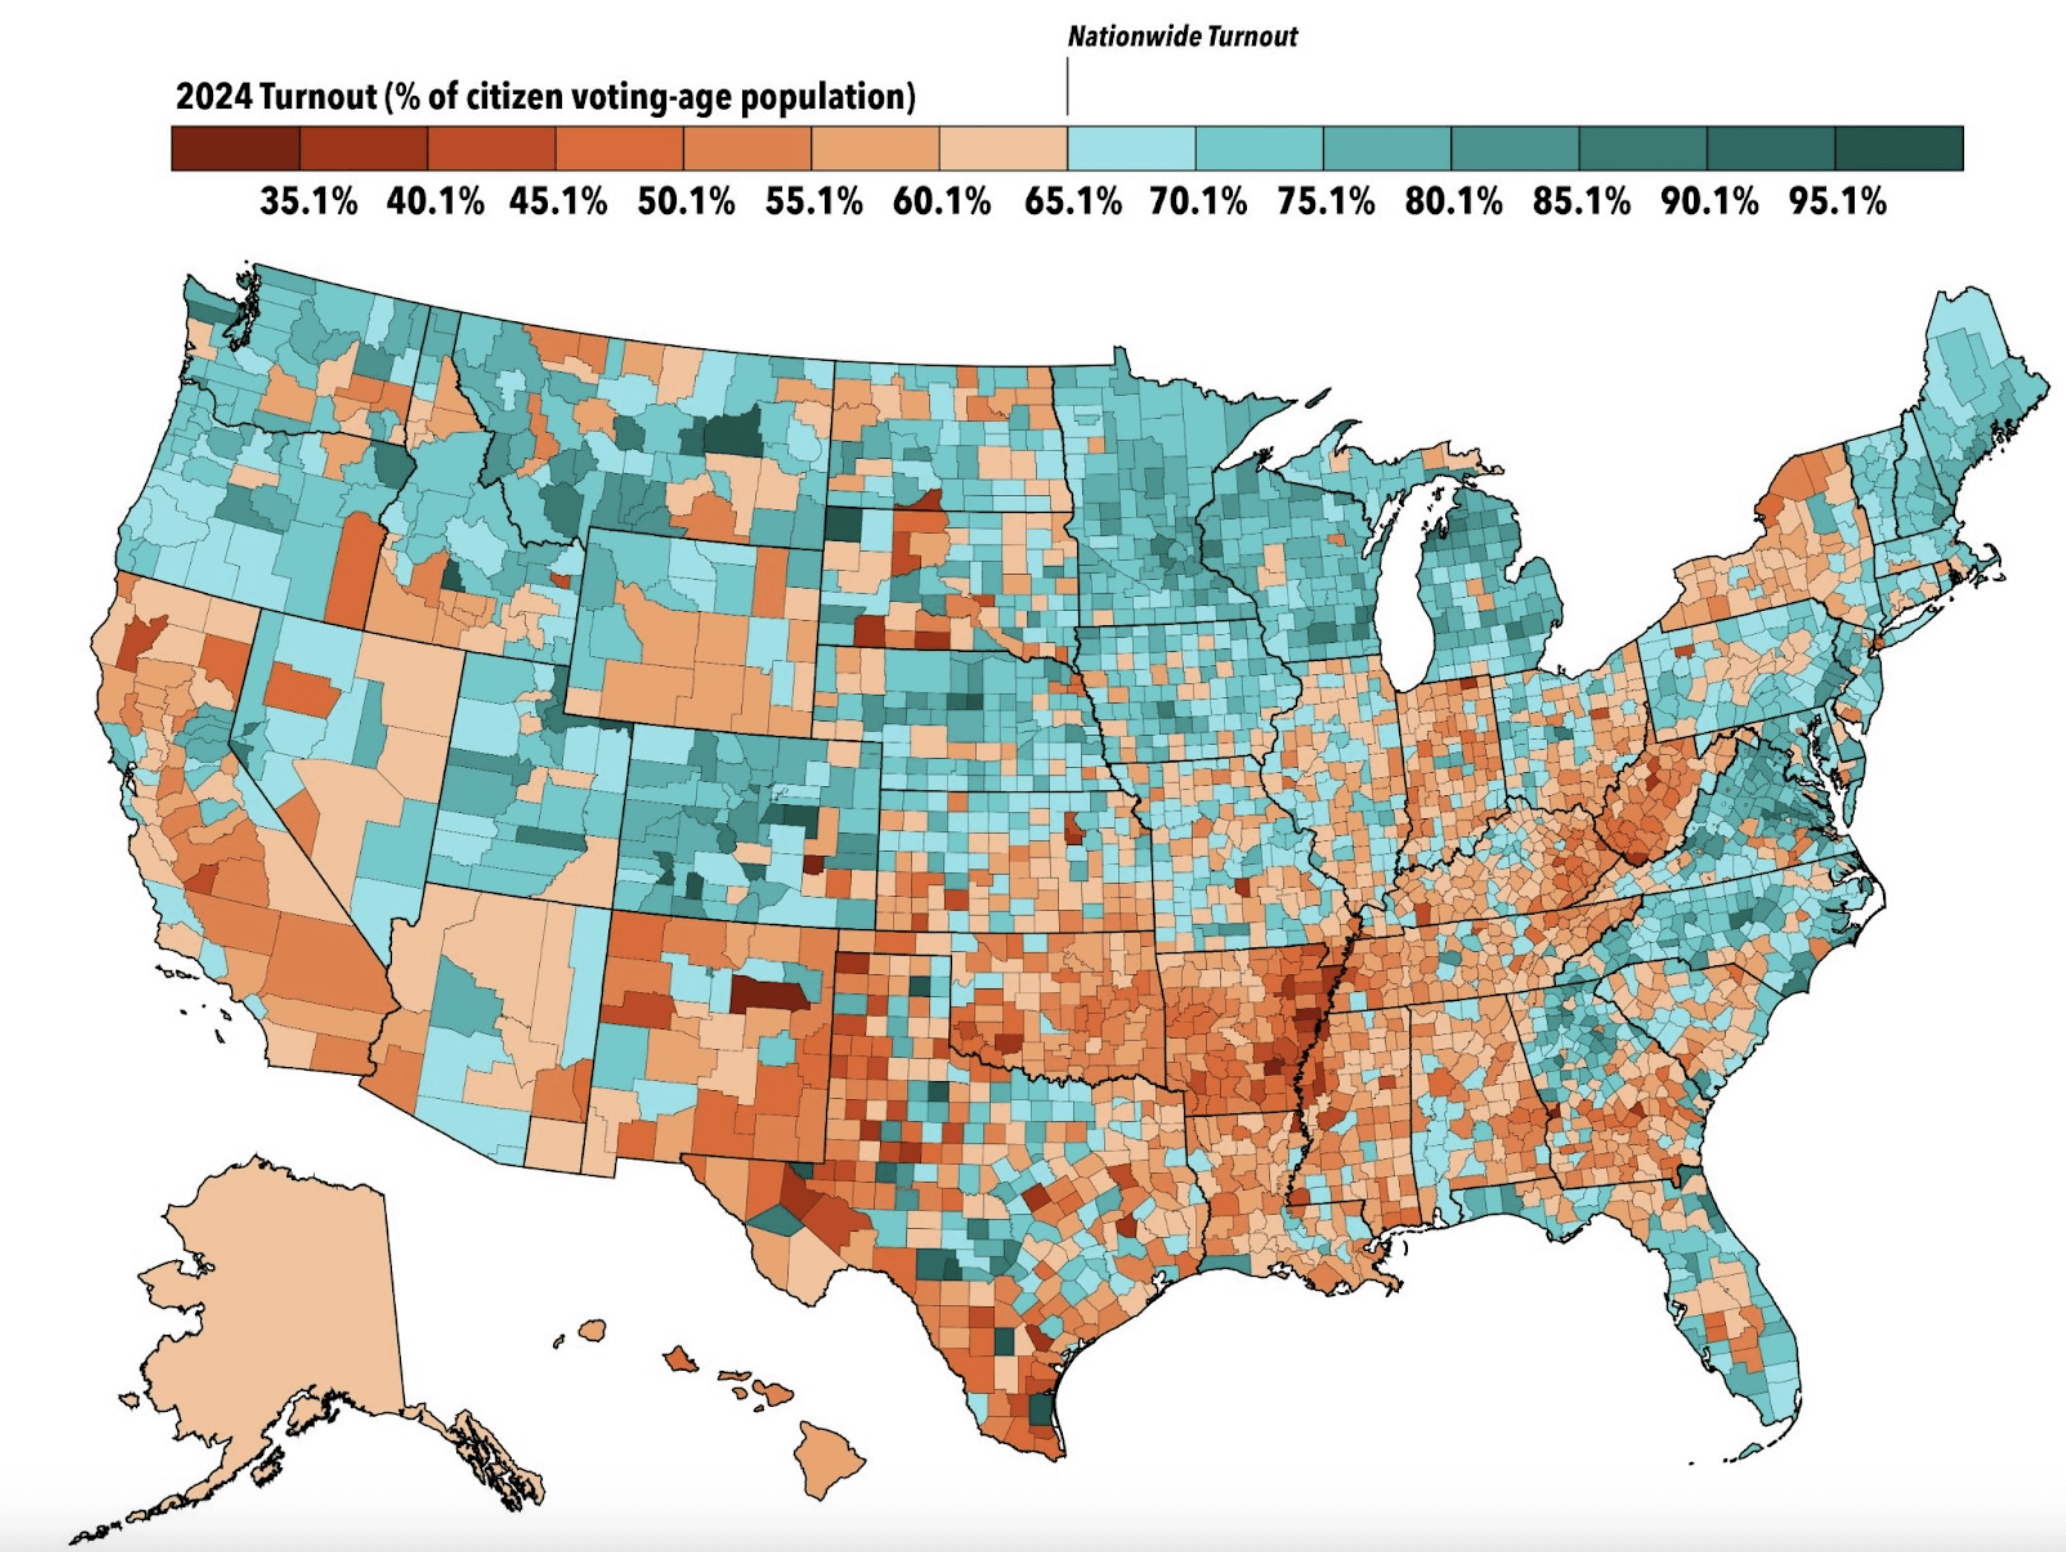
Riley County, Kansas surprises me. As a college town I would have guessed it would perform better.
TheDadThatGrills on
What is the common thread here? State voting policies?
WashOffO on
If only all were dark blue
frodeem on
This is a little confusing for me. At first I thought it was a dem vs gop map. Then I looked at the key. I think a simpler over/under a national average would work better.
Larky17 on
Worth pointing out some additional numbers:
There are roughly 244 million *eligible voters* in the United States. Eligible being both registered and not registered people. Roughly, 156 Million ballots were cast.
**88 million people chose to not vote.** That’s more votes than what either candidate received. Trump received just over 77 million and Kamala received just over 75 million.
63% of *eligible voters* cast a ballot. 31% for Trump and 30% for Kamala.
Skwonkie_ on
Indiana has unusually low turnout compared to its neighbors.
wifikitten1 on
Arkansas is apparently allergic to voting.
pokerpaypal on
On thing I notice is lower percentage on reservations. The lowest in Wisconsin is the Menomonie reservation. Pine ridge area is low. I am guessing the dark New Mexico county is a huge reservation (not saying I know for sure), but I have driven through New Mexico a few times and the signs there mark the tribal names on the highway.
LoudCrickets72 on
Just goes to show that Georgia could’ve turned blue had voter turnout not been so low
Roughneck16 on
It’s well-known that old people have the highest voter turnout, but I see Utah bucking that trend. They have a strong turnout despite their low median age. One of their low-turnout counties is Carbon County, a mostly non-LDS, working class, blue collar county. It’s the only county in Utah that supported Trump in 2016 more than Romney 2012.
scolbert08 on
Some of the anomalous dark brown counties are so colored because of large ineligible prison populations. The mapmaker used citizen voting-age population (CVAP) rather than citizen voting-eligible population (CVEP).
matt_automaton on
Now compare this to education levels by county and we’ll be cooking.
hanginbiathread on
Overlay with a map of education
ausflora on
The Australian mind cannot comprehend this.
Elemental-13 on
where’d you get the data for this?
sirbruce on
A lot of this correlates to the poorer counties (Arkansas), but what the heck happened in upstate New York?
Reasonable-Amoeba755 on
So the best turnouts were in left states and the right still won the election?
1. Does that mean the right could’ve won by an even larger margin in that election?
2. How does this reconcile against the drop in total votes for the left from previous election. If turnout was great but still less total votes does this increase the likelihood that the right has a valid argument for election fraud in 2020 election?
annnnn5 on
South Texas is interesting. Very low right next to very high numbers. Any reasons why that might be?
AGrandNewAdventure on
Minnesota: Doing our patriotic duty, every election.
ChimpoSensei on
Alaska has more than one county (called boroughs), so this map is wrong.
CHI4610NE on
I still feel so sick every time I look at anything associated with this election
LudicrousFalcon on
Minnesota my GOAT with the high turnout
r2v-42nit on
Election Truth Alliance. Hand recounts needed.
gooncrazy on
The areas of eastern Arkansas and western Mississippi have large black populations. Its showing they have lower voter turnout. I wonder it its because they feel republicans are going to win anyway. I know that’s the case in my area of Mississippi with low black turnout.
whycats on
Common northern New England W
Karen-Manager-Now on
Does this include those who can’t vote but are voting age?


26 Comments
Riley County, Kansas surprises me. As a college town I would have guessed it would perform better.
What is the common thread here? State voting policies?
If only all were dark blue
This is a little confusing for me. At first I thought it was a dem vs gop map. Then I looked at the key. I think a simpler over/under a national average would work better.
Worth pointing out some additional numbers:
There are roughly 244 million *eligible voters* in the United States. Eligible being both registered and not registered people. Roughly, 156 Million ballots were cast.
**88 million people chose to not vote.** That’s more votes than what either candidate received. Trump received just over 77 million and Kamala received just over 75 million.
63% of *eligible voters* cast a ballot. 31% for Trump and 30% for Kamala.
Indiana has unusually low turnout compared to its neighbors.
Arkansas is apparently allergic to voting.
On thing I notice is lower percentage on reservations. The lowest in Wisconsin is the Menomonie reservation. Pine ridge area is low. I am guessing the dark New Mexico county is a huge reservation (not saying I know for sure), but I have driven through New Mexico a few times and the signs there mark the tribal names on the highway.
Just goes to show that Georgia could’ve turned blue had voter turnout not been so low
It’s well-known that old people have the highest voter turnout, but I see Utah bucking that trend. They have a strong turnout despite their low median age. One of their low-turnout counties is Carbon County, a mostly non-LDS, working class, blue collar county. It’s the only county in Utah that supported Trump in 2016 more than Romney 2012.
Some of the anomalous dark brown counties are so colored because of large ineligible prison populations. The mapmaker used citizen voting-age population (CVAP) rather than citizen voting-eligible population (CVEP).
Now compare this to education levels by county and we’ll be cooking.
Overlay with a map of education
The Australian mind cannot comprehend this.
where’d you get the data for this?
A lot of this correlates to the poorer counties (Arkansas), but what the heck happened in upstate New York?
So the best turnouts were in left states and the right still won the election?
1. Does that mean the right could’ve won by an even larger margin in that election?
2. How does this reconcile against the drop in total votes for the left from previous election. If turnout was great but still less total votes does this increase the likelihood that the right has a valid argument for election fraud in 2020 election?
South Texas is interesting. Very low right next to very high numbers. Any reasons why that might be?
Minnesota: Doing our patriotic duty, every election.
Alaska has more than one county (called boroughs), so this map is wrong.
I still feel so sick every time I look at anything associated with this election
Minnesota my GOAT with the high turnout
Election Truth Alliance. Hand recounts needed.
The areas of eastern Arkansas and western Mississippi have large black populations. Its showing they have lower voter turnout. I wonder it its because they feel republicans are going to win anyway. I know that’s the case in my area of Mississippi with low black turnout.
Common northern New England W
Does this include those who can’t vote but are voting age?