
Data source: United Nations Department of Economic and Social Affairs – Population Division
https://population.un.org/wpp/
Disclaimer:
Nothing in this chart is estimated, invented, or manually adjusted.
All figures come directly from the United Nations World Population Prospects (2022 Revision).
The only thing added is visual presentation, the data itself is 100% from the UN database.
Hi all,
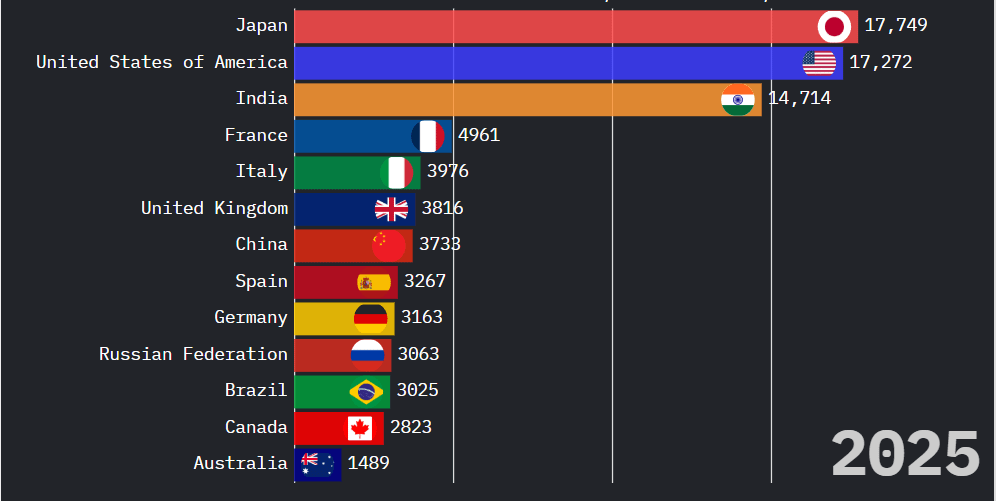
This visualization shows the projected growth in the number of people aged 100 and over (centenarians) across major countries from 2025 to 2100, using official data from the United Nations World Population Prospects (2022 Revision).
The projections are based on each country’s expected life expectancy, fertility rate, population growth, and historical aging trends.
Japan begins as the global leader in 2025, but by the end of the century, India, China, and the United States dominate the rankings, each with over 100,000 centenarians.
The data is presented year-by-year (not cumulative), showing how the aging population evolves over time.
Video here for those interested: https://www.youtube.com/watch?v=Shj9EhM7MHA
💬 Discussion Questions:
- What social or economic challenges might arise as centenarian populations increase globally?
- Which of these countries do you think are best equipped to support such a dramatic rise in very elderly citizens?
- Should this be viewed as a positive sign of global health progress — or a potential burden on future infrastructure?
Posted by drunkstoned94
7 Comments
Looks like the wildlife in Australia is keeping the men in check.
Is this supposed to be a video? All I see is numbers for 2025. Ado is this showing actual numbers? Seems low
um… I don’t think there is much difference between being 99 and being 100, just like one extra year of the same old shit. A small but larger population of relatively older peeps is more just a great sign of healthcare and science working (or simply a predictable outcome of the unprecedented number of humans born in the last century). You don’t need any more equipment for someone 90 vs 110 so really this is just a reminder to pay attention to how your population pyramids influence resource allocations.
Percent by population would be interesting.
ISA amd Japhan have roughly the same number of centarians, but tje US is almost three times the population
To be at all meaningful, this needs to be per 100k of population.
Discussion answers:
1. I don’t know, because the data isn’t per capita.
2. I don’t know, because the data isn’t per capita.
3. I don’t know, because the data isn’t per capita.
https://preview.redd.it/xehyyd26x1ag1.png?width=1478&format=png&auto=webp&s=a9ef8bc60d39be2514e822bf862ba890310b42e4
Japanese centenarian counts are of questionable accuracy.