
![[OC] My trucks sinusoidal, slowly decreasing gas mileage over the past ~7.5 years](https://www.byteseu.com/wp-content/uploads/2025/12/keegj9dhm5ag1-1536x1044.png "[OC] My trucks sinusoidal, slowly decreasing gas mileage over the past ~7.5 years")
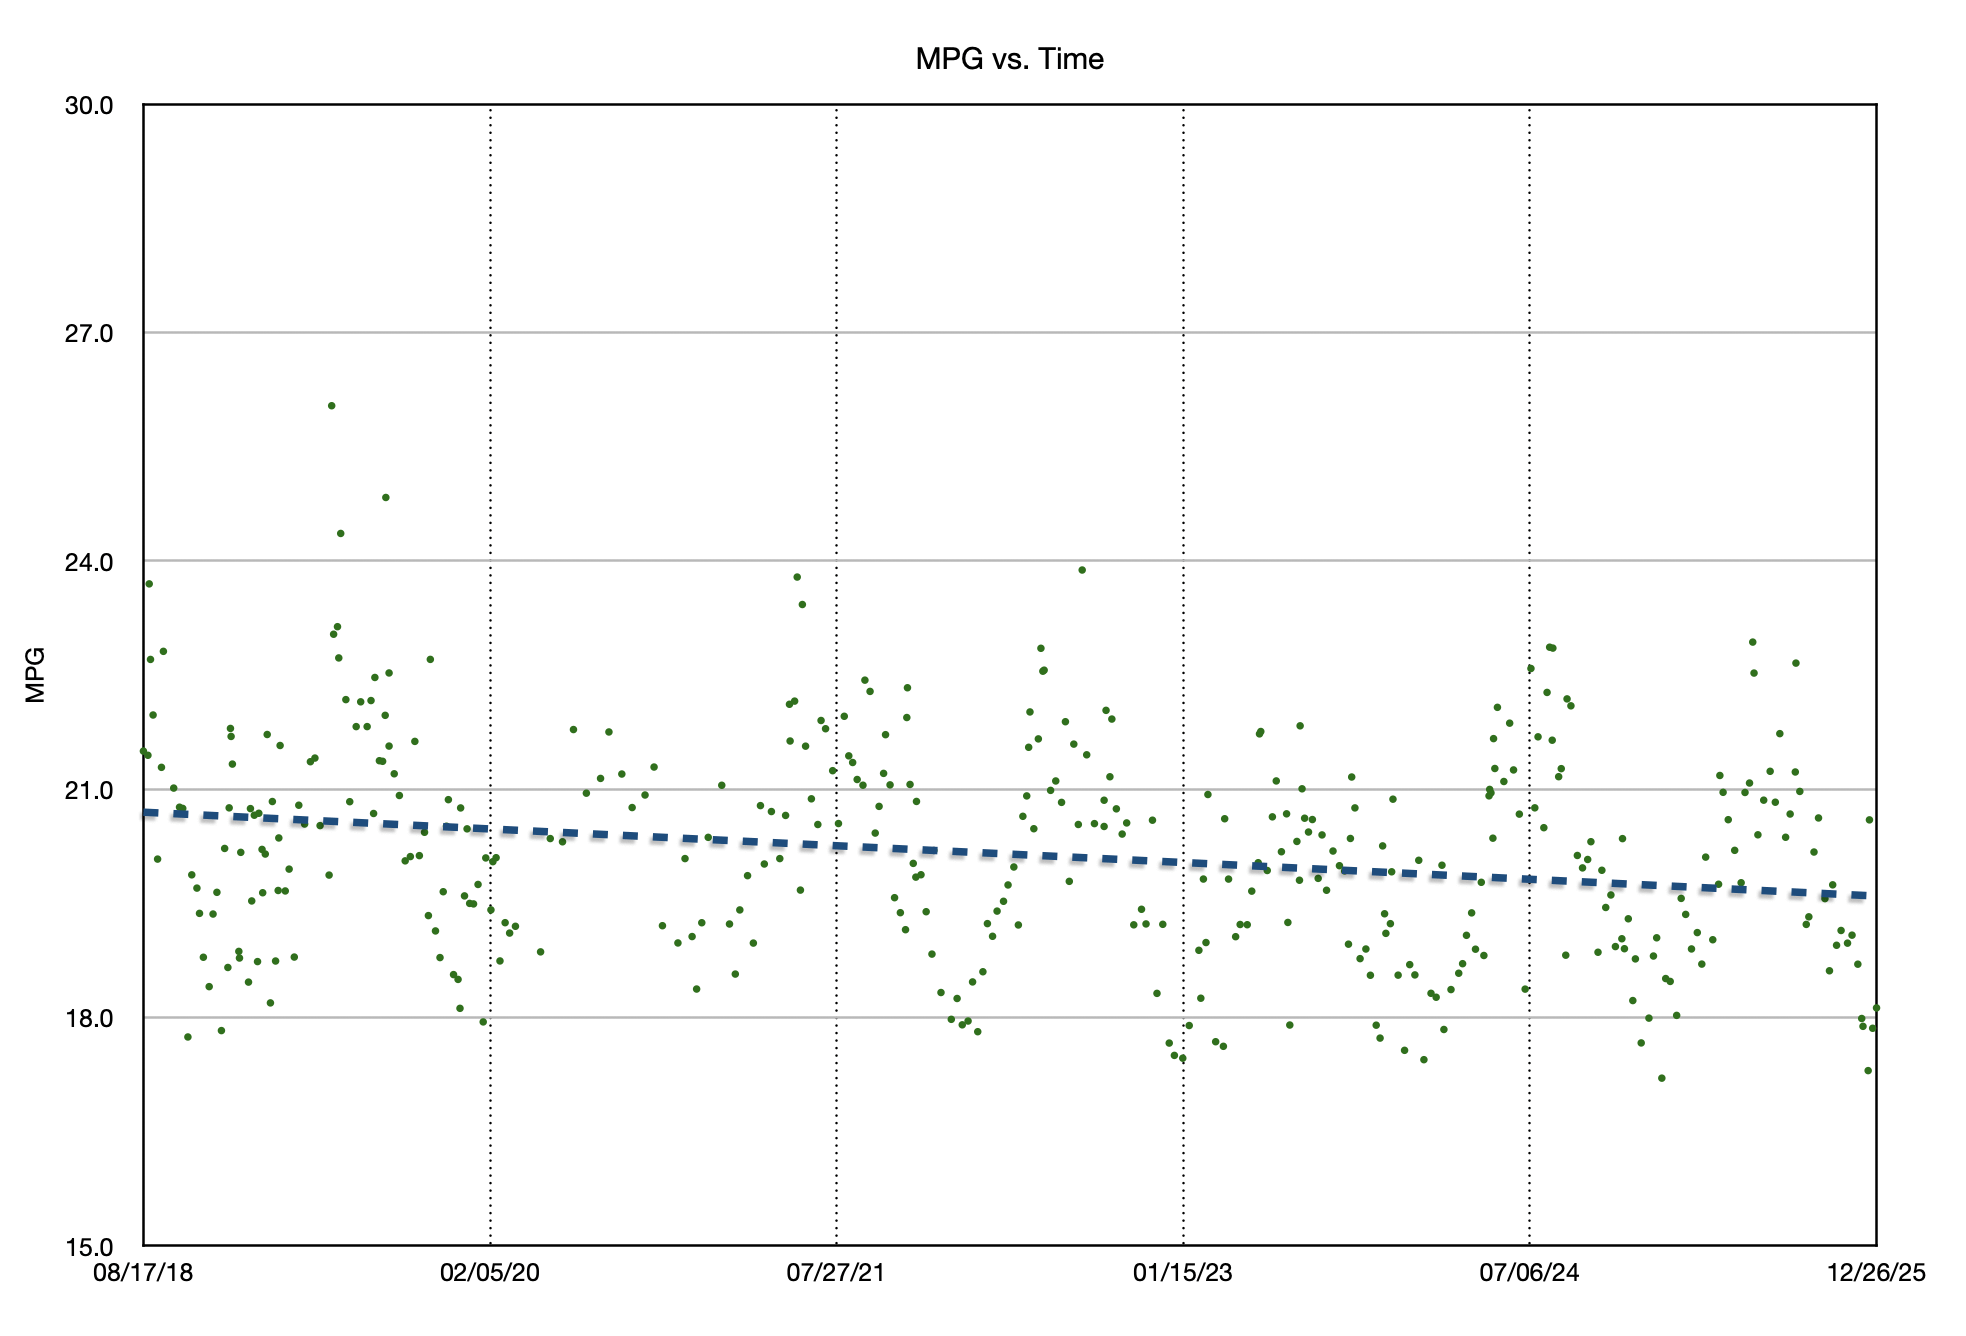
Data tracked initially on a notebook and then later directly in Apple Numbers using a shortcut. Plotted using Apple Numbers.
Very consitent trend with peaks in ~July and valleys in ~January. For context, I live in the northeast US, so this is likely a combination of factors including variable road conditions, increased use of 4WD, and gas additives. My actual truck usage does not change appreciably over the course of a year.
Posted by RamblinEagle13
30 Comments
That’s very interesting, and confirms what my gut has been telling me about my vehicle in terms of seasonality coupled with long term mechanical efficiency decline.
Great dataset! You’ve been tracking this every month since 2018? Bravo
That’s interesting. Looks like your wife also saves spare napkins and stuffs them in the glovebox.
Interesting. … Since this is DataIsBeautiful, I have to note that the x-axis isn’t quite beautiful. Would be more easily interpreted if the tick marks were at 12-month intervals.
I recently learned about summer and winter blend gasoline. Assuming this is gas and not diesel, that may also contribute to the sinusoid. Great dataset!!
This might be the first time I ever saw truly beautiful data on this sub
Tire age affects MPG. That could be it.
Wait why would it be sinusoidal? Is there a reason?
This is really cool. Thank you for your effort.
This is awesome, thanks for sharing!
You should try imposing a sinusoidal prior on the model with a 12 month period to see how well it fits.
Y = A*sin(B + freq*x) + Cx + D (assuming I’ve not messed it up)
Fix freq to whatever it needs to be for how the time series is represented, or perhaps make it a variable (I’d personally fit it).
Interesting. I can see no such effect in my data of the same thing with similar timeframe. I wonder why yours looks so predetermined.
https://preview.redd.it/bvu4ier8r5ag1.png?width=913&format=png&auto=webp&s=2e407d287e6a2ca6922d1ad1f6893736a571edef
My grandparents logged mileage and gallons with each fill up on every car they drove. He sold used cars from his front yard and the little book with that info went with the car.
I’d love to have seen him plot this out. He worked for Boeing back in the day and was prone to that kind of stuff.
This is very interesting.
Care to share the data? This would be a great dataset to use for teaching
Simply colder temperatures resulting in the engine spending more time running cold contributes to the periodic trend as well.
This is really cool, there’s some info here that I wish I had.
What is the year make and model of vehicle? Could you mark when you changed oil? When you filled tire pressure? When you replaced tires? Tires have the biggest impact on fuel economy in a normally operating vehicle so I’d love to have more data points here. Did you switch brands of tires? Assuming they were replaced in the 7 years you had the vehicle. How many miles did you put on the vehicle in this time period.
I am just wondering what other factors could be at play here.
How many miles/year and in total?
I love this. Thank you. I have a lot of people telling me my EV will lose range and efficiency over time but don’t believe me when I say that ICE do too. This is really beautiful data.
Very similar to EVs, slow degradation over time with wild swings in efficiency between winter and summer.
https://www.epa.gov/gasoline-standards/gasoline-reid-vapor-pressure
Actually, interesting data.
I would add that apart from fuel, tires have a large impact on fuel economy, if you are not vigilant about maintaining tire pressures. Also, being in the NE if you switch from summer to winter tires or from normal to run flats.
That’s interesting. Make and model? What maintenance have you done over the 7.5 years and when?
So seasonally you see about a 25% drop in efficiency, and over 7 years have seen about a 5% drop. Interestingly this seams pretty close to what EVs see
Used up 02 sensors can affect this too.
I’ve heard that gas stations switch to “winter gas” in mid September, which effects fuel efficiency.
This combined with color winter combustion temps, longer warm up times, and 4wd push the average down.
You ought to annotate the mileage with oil changes, just to see if there’s a meaningful impact.
Dude! THIS is what I’m here for. This is beautiful data.
Nice dataset. Similarly, I tracked my fuel efficiency for ~8’ish years and had similar seasonal fluctuations. I picked up a consistent 6% efficiency switching to full synthetic oil and a K&N air filter, if any value to you. I should dig up that dataset…
Now that most vehicles do a good job tracking for me I’ve become too lazy to do it manually!
Funny to see this as I do the exact same thing with all my cars (example below for a car that finally gave the ghost in 2024 – indeed tracked using a numbers spreadsheet). I simply record the mileage and added gas when I fill er up and the spreadsheet calculates the real mpg from those. I have not seen your kind of long term trend on my cars. They have mostly been consistent over the years. The seasonality is mostly due to the fuel mix changing in winter to cut down on air pollution I believe. Also days of long highway drives like on a road trip should give higher mpg spikes as ICE cars have higher mpg when driving at constant highway speeds as you don’t get the big losses from constant deceleration and acceleration that happen in city driving. One thing you can see in the graphs is some issues that needed repair like this car’s catalytic converter going bad in january 2016. The gas mileage went down precipitously before the car showed other signs. I had a bad sensor in 2018 explaining that outlier. so keeping track of this is useful to catch some issues before they become bigger.
https://preview.redd.it/o8ji7q95t5ag1.png?width=2128&format=png&auto=webp&s=ffa636fb76c273d758ff83ffca65e6e2181a6f90
You might want to employ that in conjunction with a drawn reciprocation dingle arm to reduce sinusoidal repleneration.