
This is my first time parsing this data from the Florida Department of Revenue. The report is called Gross Sales and covers about $1.9T in transactions annually, segmented by month and attributable industry.
Attached are some YoY snapshots by industry from January 2022 to September 2025. I’m sharing these slides because of the outliers, listed below.
Please share your insights, explanations and/or speculations.
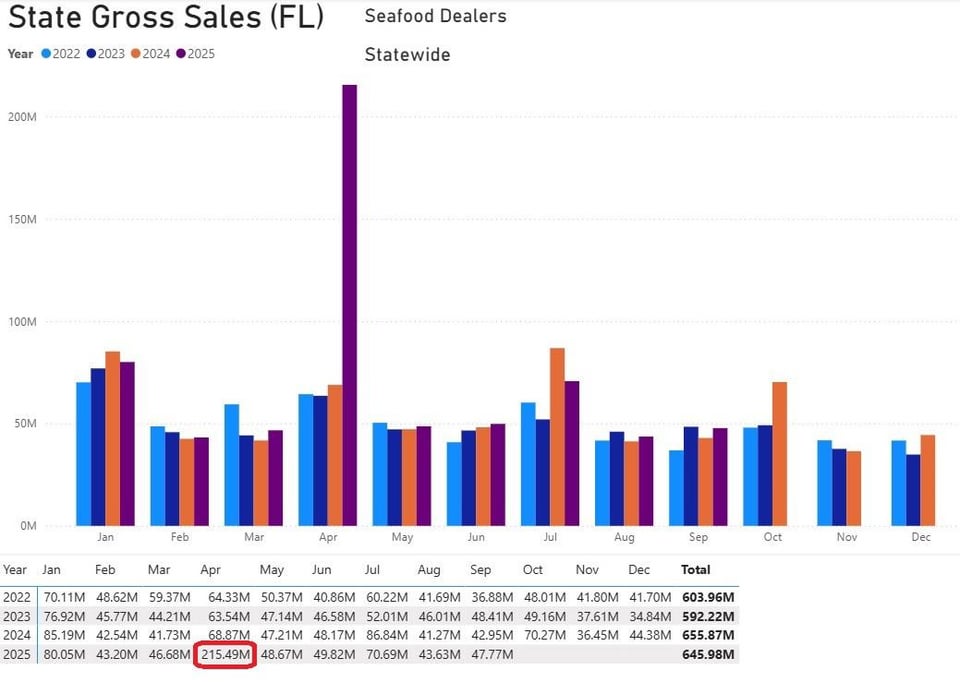
- an extra $150M of seafood in April 2025
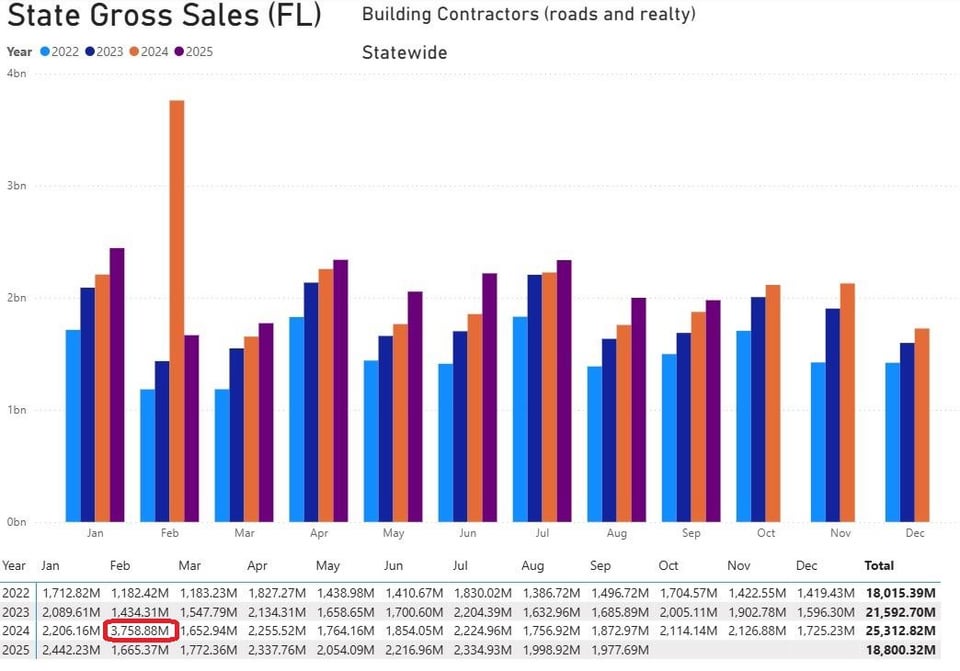
- building and construction twice the monthly amount in February 2024
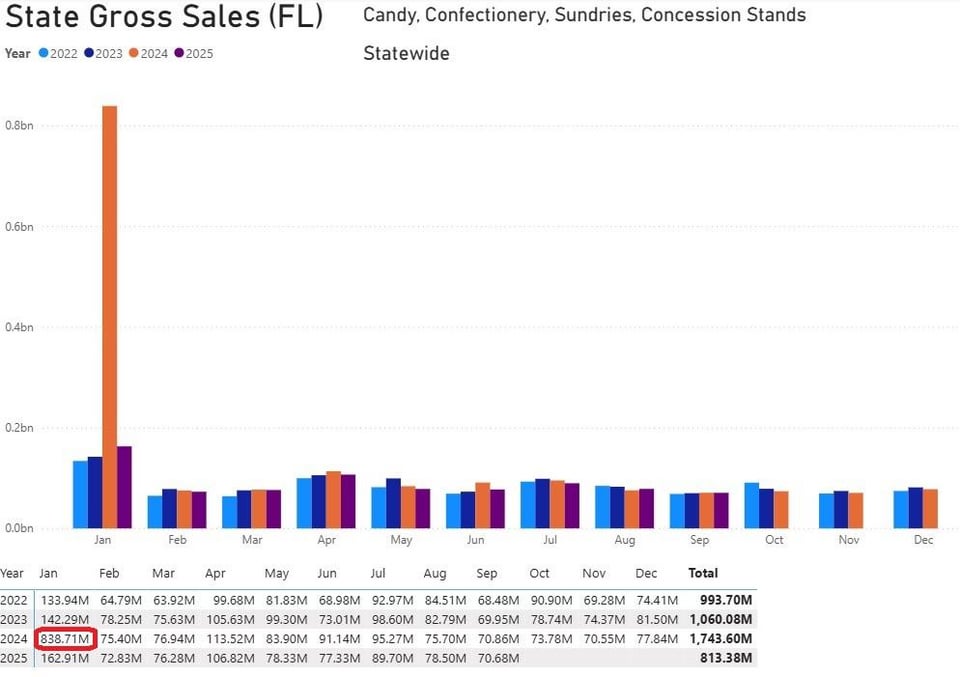
- an extra half billion in candy?
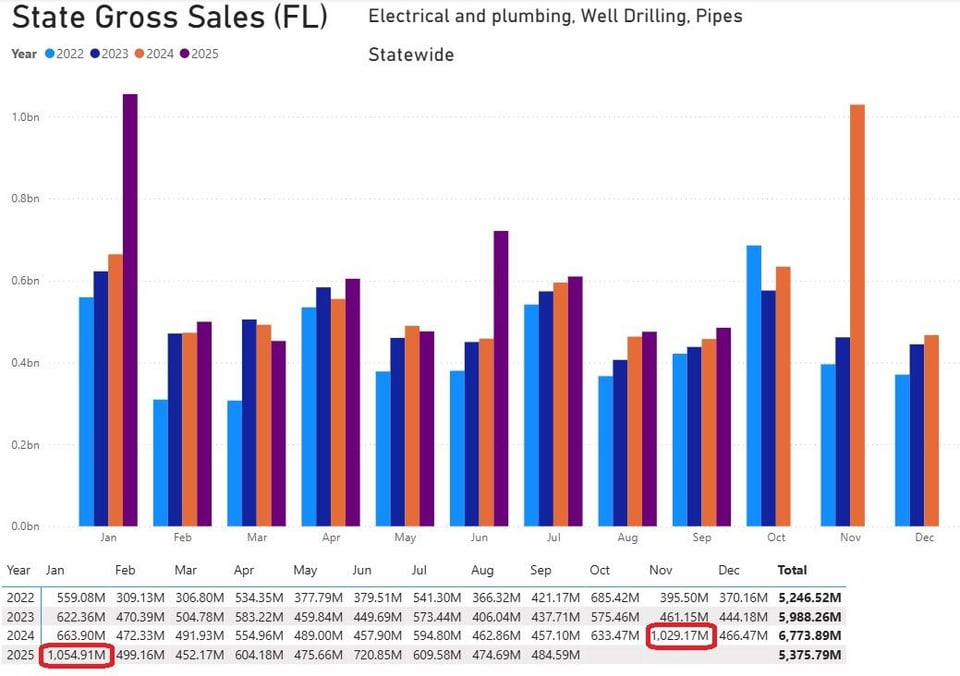
- atypical spending on plumbing and electrical, November 2024 and January 2025
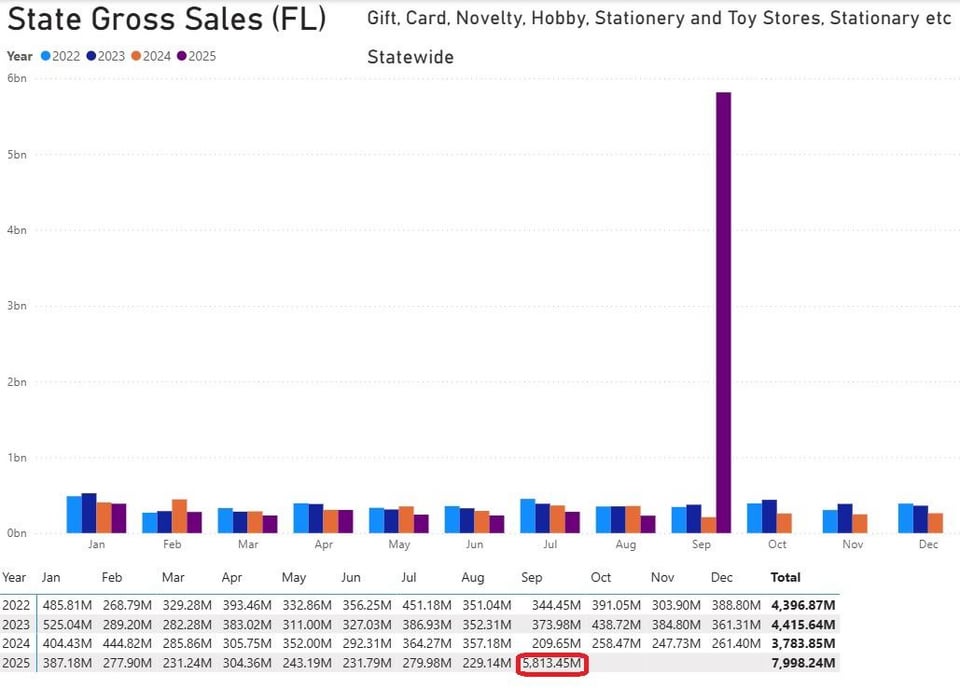
- What’s going on with gifts, cards, hobbies, etc.? Several extra billion reported in September 2025. October is not available yet. Maybe this is a category change.
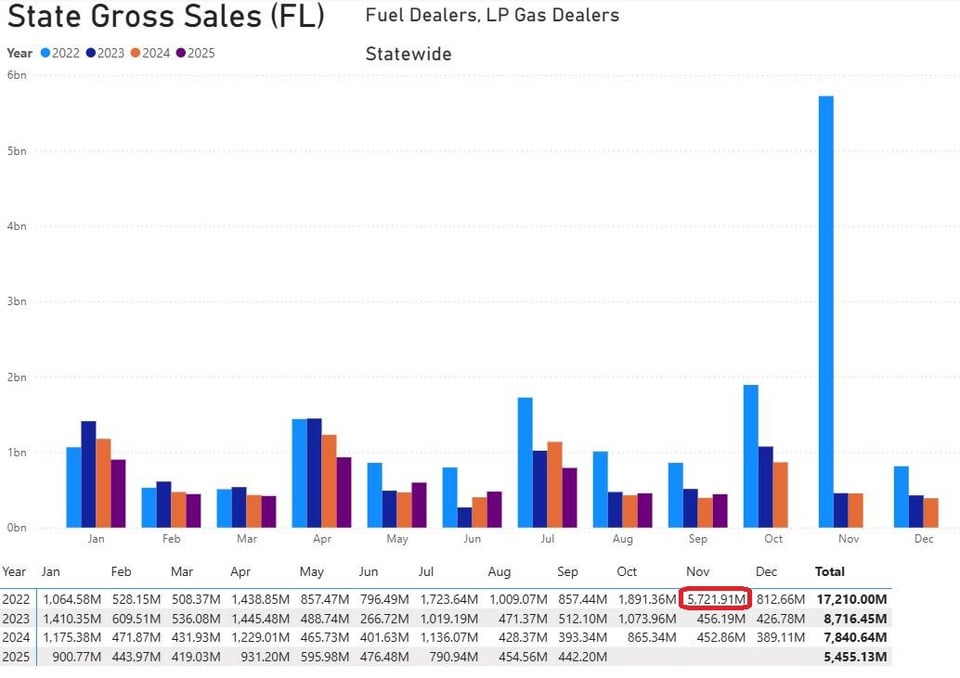
- what’s up with fuel in 2022?
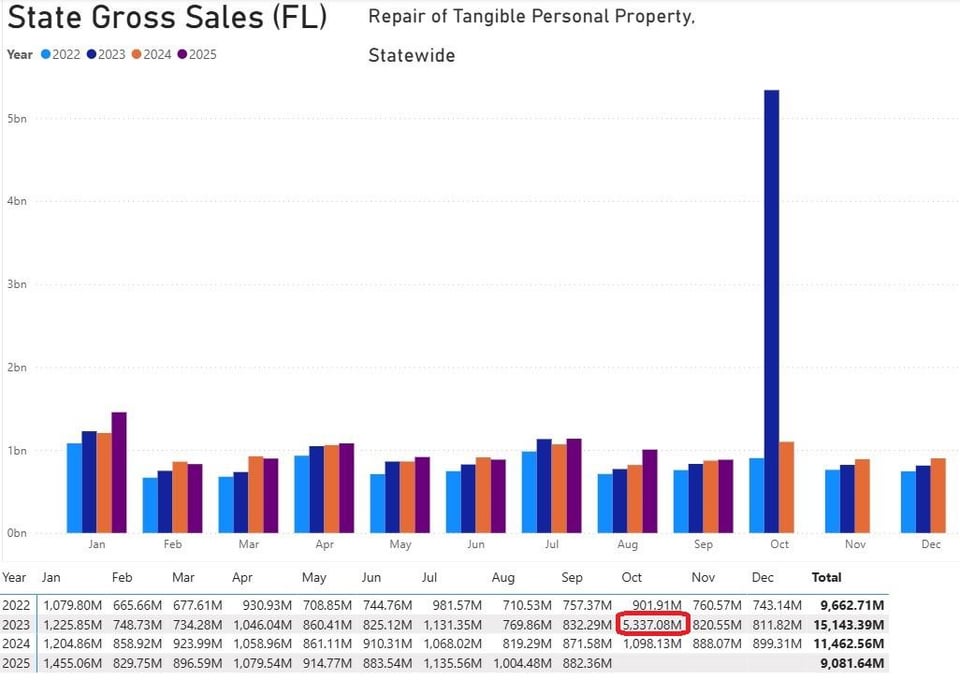
- An extra 4 billion in tangible property repair, October 2023
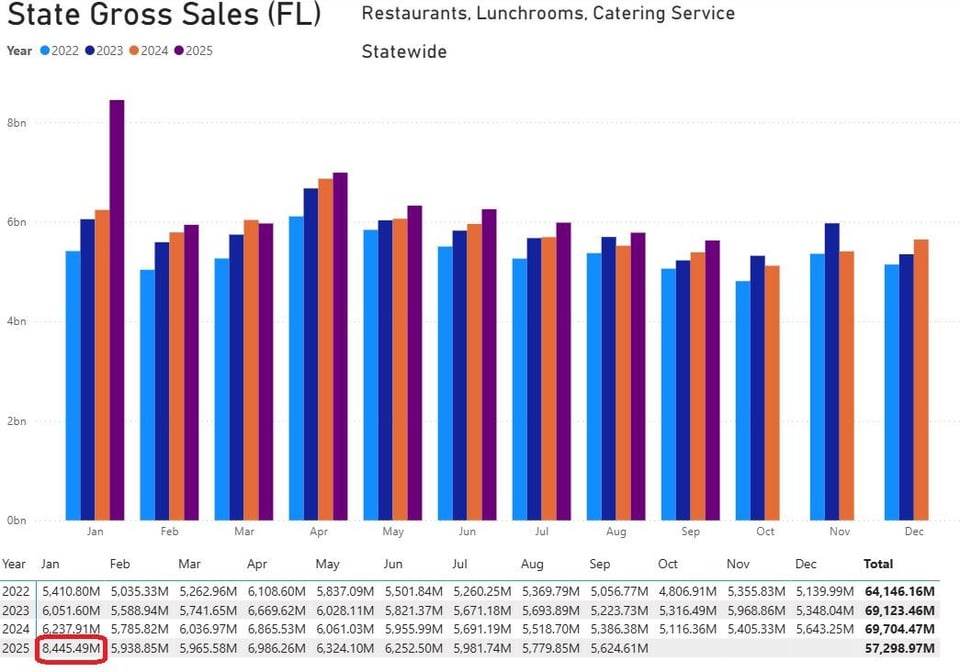
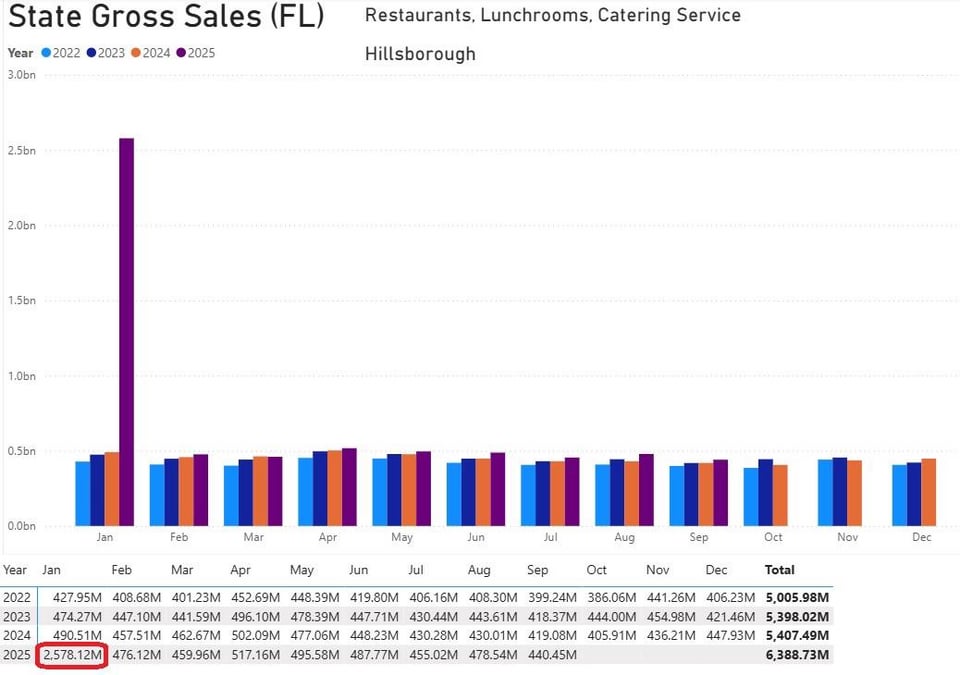
- Over 2 billion in additional restaurant sales in January 2025. Most of this difference was just Hillsborough county.
Posted by Scotty_Gun
3 Comments
Fishy AF! OP you have either found that FL’s reporting is terrible or several major money laundering operations.
Would it be a lot of suppliers attempting to make a lot of purchases before tariff taxes kicked in, all of which would be passed on to their customers?
Looks like bad data keeping, crime, or weird (large) reactions to very specific market conditions. Wouldn’t be surprised if an investigative reporter found crimes underneath those anomalies in FL given the dates and scale of difference.