
![[OC] Median Zillow home listing price in USA](https://www.byteseu.com/wp-content/uploads/2026/01/fbshmptqzdbg1-1024x598.png "[OC] Median Zillow home listing price in USA")
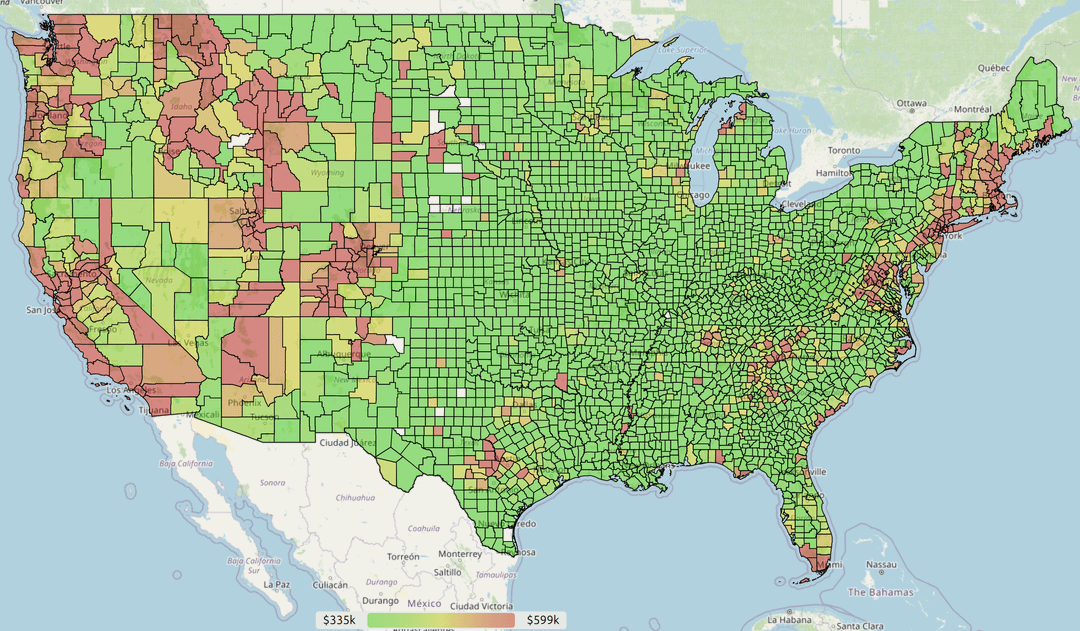
I received a lot of positive feedback for a tool I posted here two months ago, so my friend and I added several features and updated it with data for every state. Attached are some screenshots generated with the tool. The listing price scale was calculated with 33rd percentile as the low end, and 66th percentile as the upper.
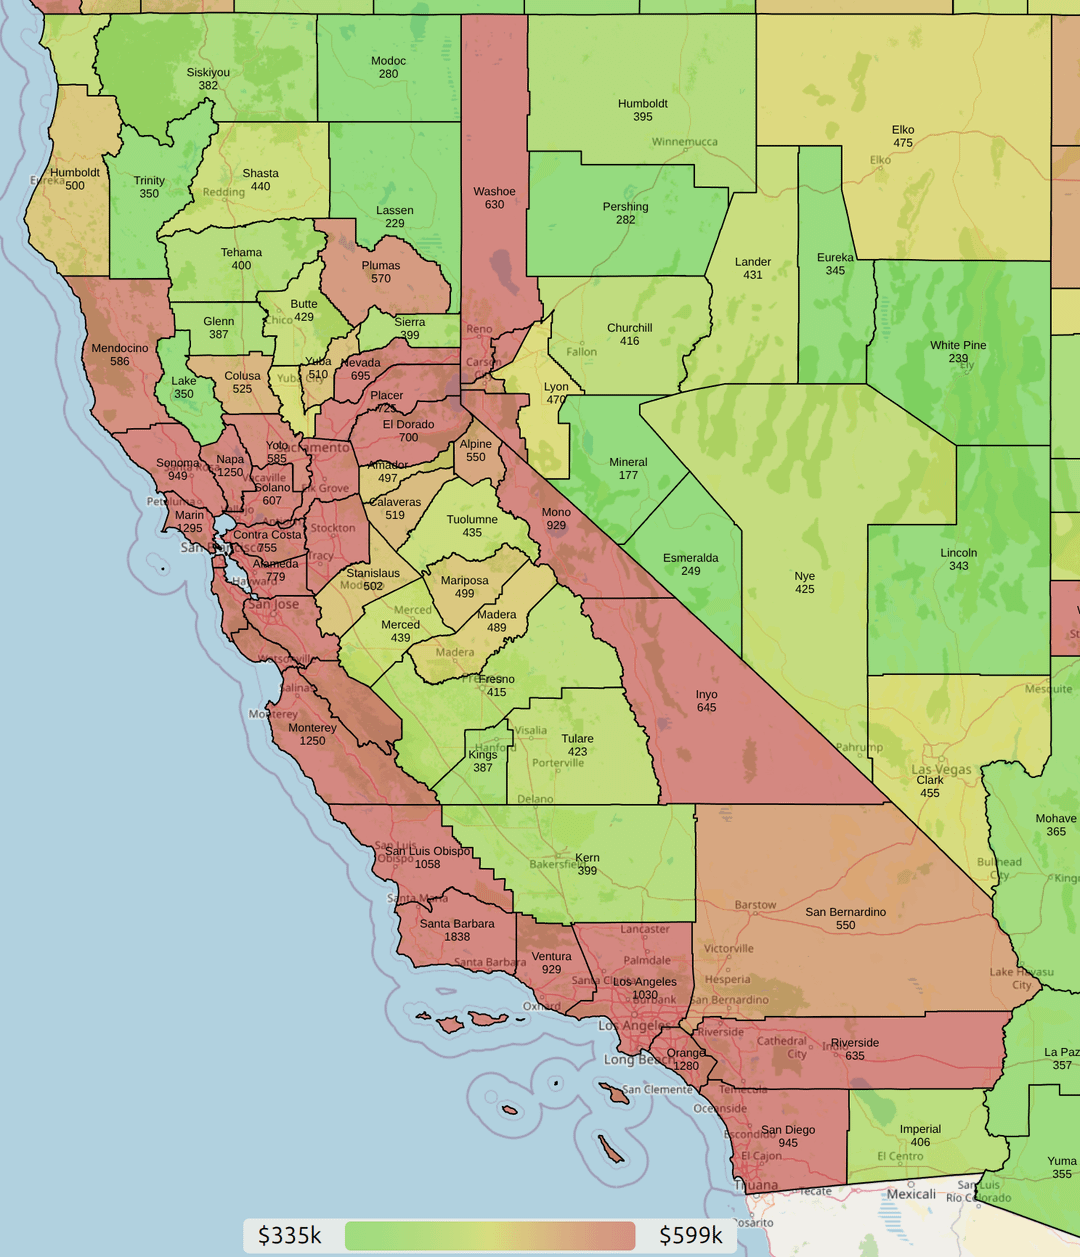
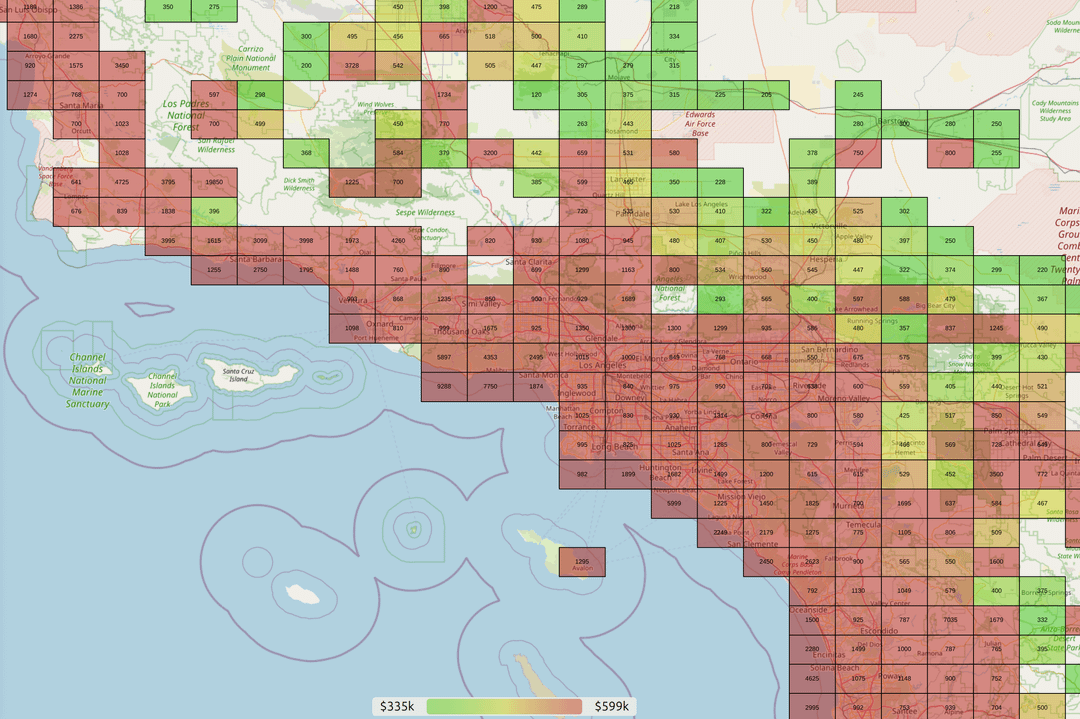
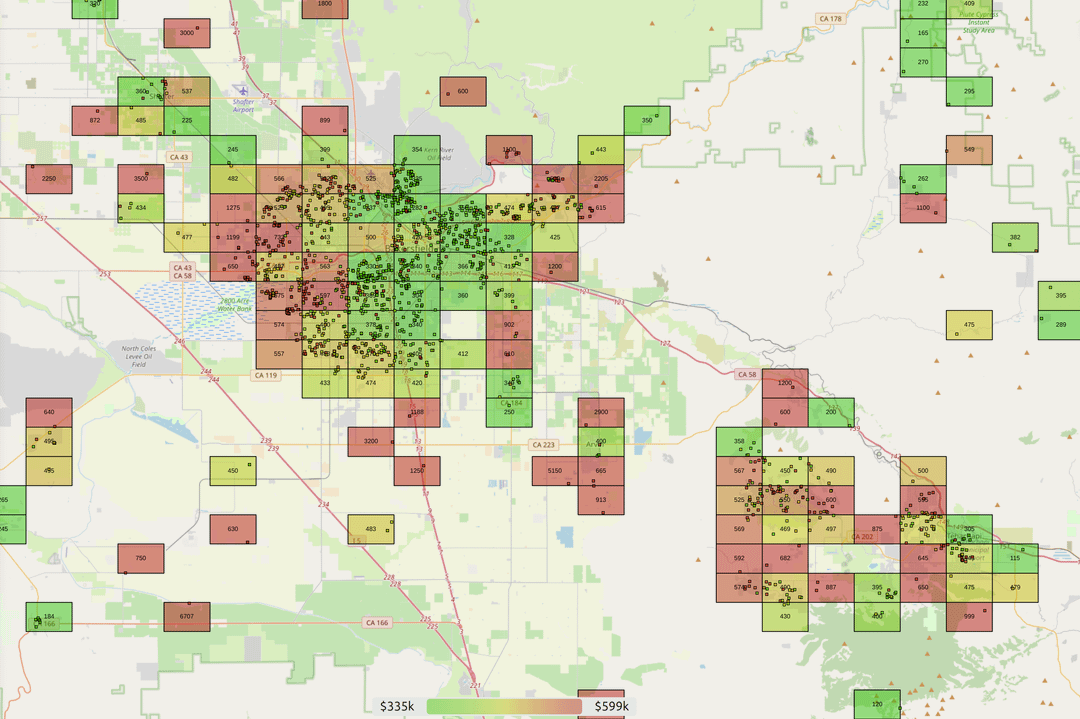
This tool shows *all* Zillow home listings, median price by county, and dynamically generated median boxes which make it easier to find affordable areas. There are 1.85 million listings, which were collected using a generous grant of free credits from hasdata.com on 11/11/2025.
Posted by f33tpix
12 Comments
Homes seem cheap tbh coming from Ireland…
What €700’000 or $820’000 would get you in Dublin…
https://www.daft.ie/for-sale/house-12-may-street-drumcondra-dublin-9/6458471
€725’000
https://www.daft.ie/for-sale/terraced-house-85-taney-avenue-goatstown-dublin-14/6316252
€500’000
https://www.daft.ie/for-sale/semi-detached-house-48-grange-abbey-drive-grange-abbey-baldoyle-dublin-13/6295138
€450’000 – 50m2
https://www.daft.ie/for-sale/house-15-greenmount-lane-dublin-12/6448499
Most houses sell above asking price also…
[deleted]
Shout out to Iowa for having such clean county lines.
Why is the top 599k? That is a tear down in a bad part of town in the bay area.
the craziest thing to me is how mountains have become as desirable as the coasts. the prices in rural areas of Colorado, Utah, Idaho and Montana are wild to me.
Looks like West Virginia is the only state entirely in green
And Rhode Island entirely in orange/red
Weird. It’s almost like it’s more expensive in the places people want to live.
Isn’t this just a people live in cities map?
Why use the listing price? The sales price is far more informative, that and (via a very unscientific eyeball review of the two prices on Zillow) there can be a dramatic difference between the two with the sales price predominately lower than the listing price (at least for the moment).
People talk shit about Ohio but the median home price in my city is $124k. I bought my house ten years ago for a little over half that. Even now there’s a ton of decent houses available for well under $100k
Great can’t even afford to live in green.
On behalf of all colour blind people… Eh!