

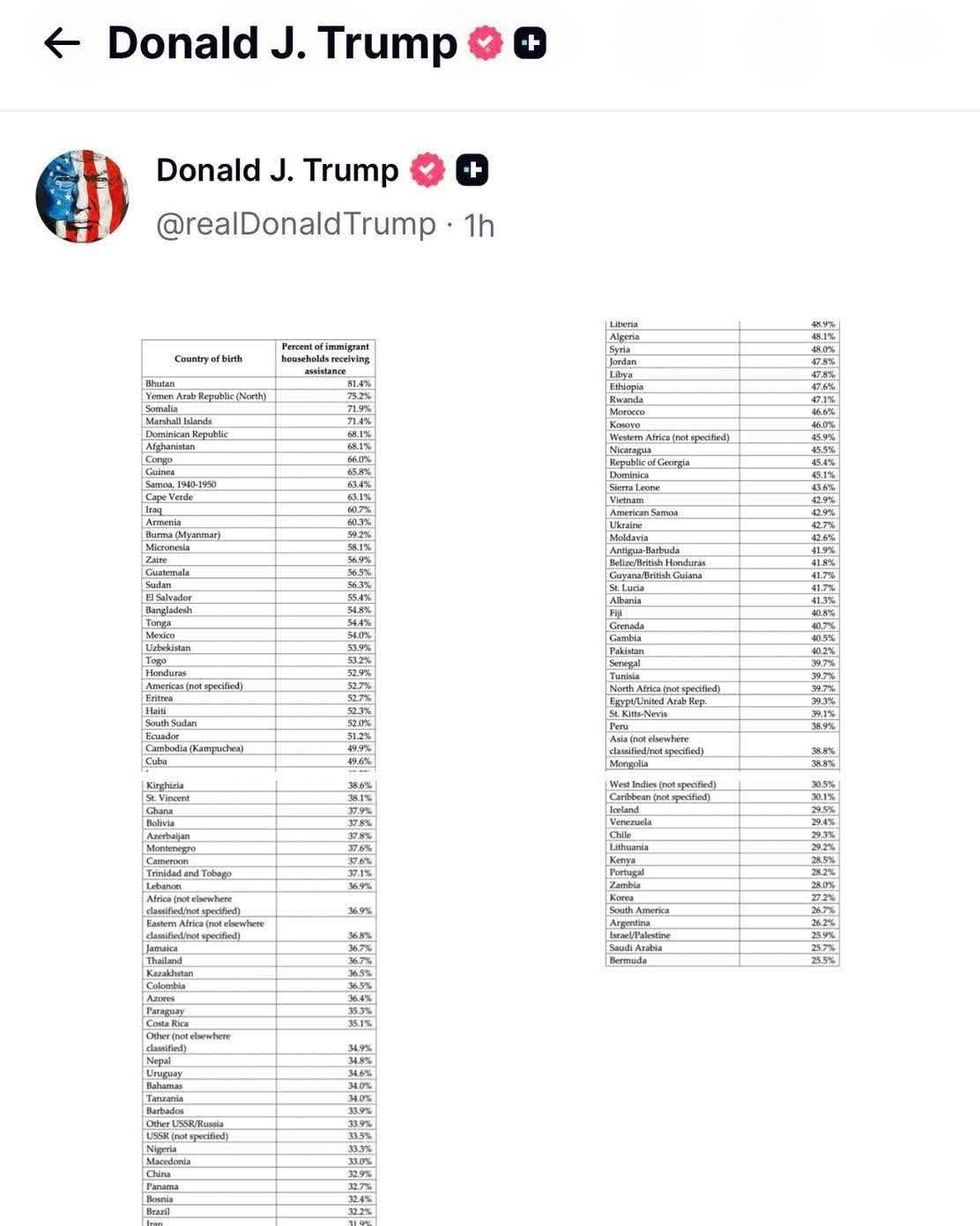
United States President Donald Trump recently published on social media a table with statistical data on the benefit of social assistance by immigrant families in the US, reopening the debate on social policies and immigration.
According to distributed data, about 46 percent of families of Kosovo origin living in the United States benefit from various forms of social assistance, including financial assistance, housing programs, and health support.
Kosovo ranks among the countries with a relatively high percentage of benefiting from these schemes, alongside several other countries from Africa, Asia and Latin America.
The publication of these figures comes at a time when the US administration has brought back attention to the need to review the social assistance system, arguing that it should be oriented more towards promoting employment and economic self-sustainability.
On the other hand, representatives of the Albanian diaspora in the US emphasize that these statistics should be seen in context.
According to them, a significant portion of the beneficiaries are young immigrant families, refugees, or people in the early stages of integration, who over time become active contributors to the labor market and the American economy.
Country of origin
Percentage of immigrant families receiving social assistance
Bhutan – 81.4%
Yemen Arab Republic (North) – 75.2%
Somalia – 71.9%
Marshall Islands – 71.4%
Dominican Republic – 68.1%
Afghanistan – 68.1%
Congo – 66.0%
Guinea – 65.8%
Samoa (1940–1950) – 63.4%
Cape Verde – 63.1%
Iraq – 60.7%
Armenia – 60.3%
Burma (Myanmar) – 59.2%
Micronesia – 58.1%
Zaire – 56.9%
Guatemala – 56.5%
Sudan – 56.3%
El Salvador – 55.4%
Bangladesh – 54.8%
Tonga – 54.4%
Mexico – 54.0%
Uzbekistan – 53.9%
Togo – 53.2%
Honduras – 52.9%
America (unspecified) – 52.7%
Eritrea – 52.7%
Haiti – 52.3%
South Sudan – 52.0%
Ecuador – 51.2%
Cambodia – 49.9%
Cuba – 49.6%
Kyrgyzstan – 38.6%
Saint Vincent – 38.1%
Ghana – 37.9%
Bolivia – 37.8%
Azerbaijan – 37.8%
Montenegro – 37.6%
Cameroon – 37.6%
Trinidad and Tobago – 37.1%
Lebanon – 36.9%
Africa (unclassified) – 36.9%
East Africa (unclassified) – 36.8%
Jamaica – 36.7%
Thailand – 36.7%
Kazakhstan – 36.5%
Colombia – 36.5%
Azores – 36.4%
Paraguay – 35.3%
Costa Rica – 35.1%
Other (unclassified) – 34.9%
Nepal – 34.8%
Uruguay – 34.6%
Bahamas – 34.0%
Tanzania – 34.0%
Barbados – 33.9%
Former USSR/Russia – 33.9%
USSR (unspecified) – 33.5%
Nigeria – 33.3%
Macedonia – 33.0%
China – 32.9%
Panama – 32.7%
Bosnia – 32.4%
Brazil – 32.2%
Iran – 31.9%
Liberia – 48.9%
Algeria – 48.1%
Syria – 48.0%
Jordan – 47.8%
Libya – 47.8%
Ethiopia – 47.6%
Rwanda – 47.1%
Morocco – 46.6%
Kosovo – 46.0%
West Africa (unspecified) – 45.9%
Nicaragua – 45.5%
Republic of Georgia – 45.4%
Dominica – 45.1%
Sierra Leone – 43.6%
Vietnam – 42.9%
American Samoa – 42.9%
Ukraine – 42.7%
Moldova – 42.6%
Antigua and Barbuda – 41.9%
Belize/British Honduras – 41.8%
Guyana/British Guiana – 41.7%
Saint Lucia – 41.7%
Albania – 41.3%
Fiji – 40.8%
Grenada – 40.7%
Gambia – 40.5%
Pakistan – 40.2%
Senegal – 39.7%
Tunisia – 39.7%
North Africa (unspecified) – 39.7%
Egypt/United Arab Republic – 39.3%
Saint Kitts and Nevis – 39.1%
Peru – 38.9%
Asia (unclassified) – 38.8%
Mongolia – 38.8%
West Indies (unspecified) – 30.5%
Caribbean (unspecified) – 30.1%
Iceland – 29.5%
Venezuela – 29.4%
Chile – 29.3%
Lithuania – 29.2%
Kenya – 28.5%
Portugal – 28.2%
Zambia – 28.0%
Korea – 27.2%
South America – 26.7%
Argentina – 26.2%
Israel/Palestine – 25.9%
Saudi Arabia – 25.7%
Bermuda – 25.5%