

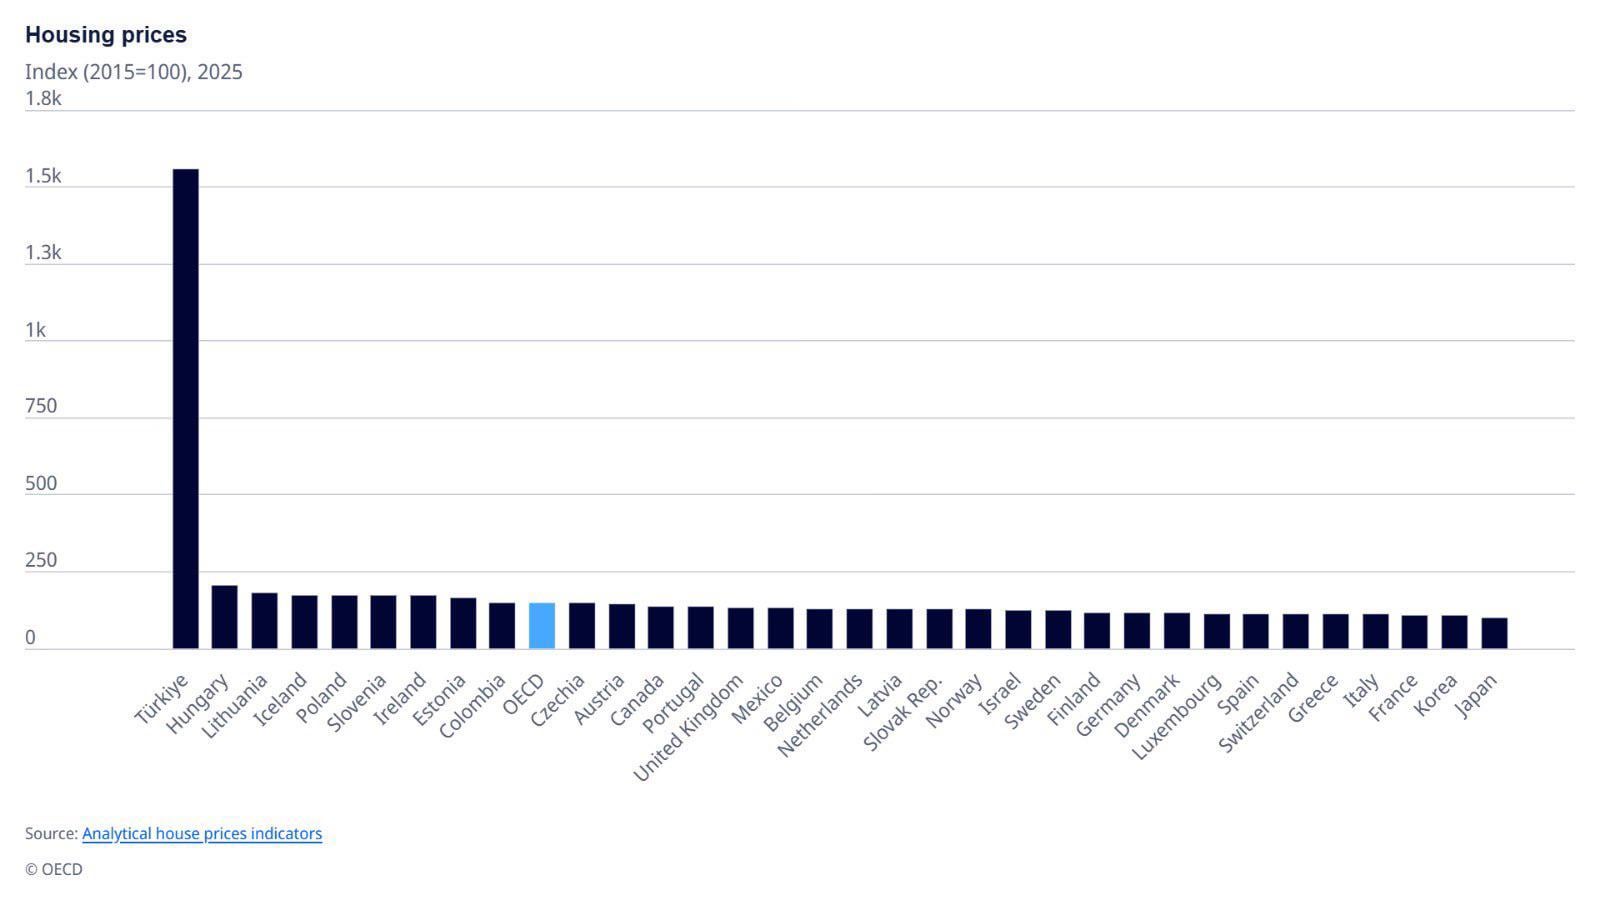
Turkey🇹🇷: 1558
Hungary🇭🇺: 206
Lithuania🇱🇹: 184
Iceland🇮🇸: 176
Poland🇵🇱: 174
Estonia🇪🇪: 165
Colombia🇨🇴: 149
Canada🇨🇦: 137
UK🇬🇧: 132
Mexico🇲🇽: 132
Norway🇳🇴: 127
Germany🇩🇪: 117
Spain🇪🇸: 114
Italy🇮🇹: 113
France🇫🇷: 110
Korea🇰🇷: 109
Japan🇯🇵: 100
Cr: https://x.com/economyinformal/status/2007895609492287954?s=46
https://i.redd.it/sbx4z3vwohbg1.jpeg
Posted by aykutt_q
11 Comments
ZİRRRVEEEEEEEE.
https://preview.redd.it/2twfbk0ephbg1.jpeg?width=320&format=pjpg&auto=webp&s=df3bee8cb199cea111b6e016590d4c6676780cec
AAAÂUUUUUUUUUU🐺🐺🐺🇹🇷🇹🇷🇹🇷🇹🇷🇹🇷🇹🇷
EN YAKIN RAKİBİMİZE 1300 PUAN KOYMUŞUZ.
“omo korocolor molomozo çokmoyo çoloşoyo oğbo”
ver mehteri verrrr
A-ama savunma sanayisi 😢
Kur etkisinden arındırılmamıș bu tarz grafiklerin hiçbir anlamı yok. Saçma sapan bir șey. Bu grafiğin aynısını “öğretmen maașları” diye de paylașabilirsiniz. Bomboș bir veri.
Eksi yiyeceğim ama gerçekleri söylemem gerekiyor. Yerel birim baz alınarak hazırlandığı için yanıltıcı bir tablo. 2015 yılında 949 TL asgari ücretle kiralanan fiyatlarla bugünkü 27 bin lira asgari ücretle kiralanan ücretleri kıyaslamak doğru sonuç vermez.
Verinin aciklamasi yok mu?
Döviz bazında düşmüş amk.
Ortalama maaş ve asgari ücrete de baktığında yine şu anda aynı seviyelerde kiralar.
Olay şu 2015 de bok gibi bir alım gücümüz vardı, 2025’te de durum aynı.
Bu grafiğin hiç bir anlamı yok, çöp olmuş bir para birimini baz alıyor.
Housing prices include housing rent prices indices, real and nominal house prices indices, and ratios of price to rent and price to income. In most cases, the nominal house price index covers the sales of newly-built and existing dwellings, following the recommendations from the RPPI (Residential Property Prices Indices) manual. The real house price index is given by the ratio of the nominal house price index to the consumers’ expenditure deflator in each country from the OECD national accounts database. Both indices are seasonally adjusted. The price to income ratio is the nominal house price index divided by the nominal disposable income per head and can be considered as a measure of affordability. The price to rent ratio is the nominal house price index divided by the housing rent price index and can be considered as a measure of the profitability of house ownership. The price to income and price to rent ratios are indices with base year 2015.
Açıklaması
yerel para cinsinden ise pek bisey ifade etmiyor. usd olsa daha iyi fikir verir
Bu grafiğin anlamsız olduğunu anlamak için çok da kafa yormaya gerek yok. Ev fiyatarı 15.8 kat artmış grafiğe göre, bu süreçte asgari ücret de 23 kat arttı. Gelir endeksi diye bir grafik açıp Türkiye’yi en başta 2015’e göre 23 kat artmış olarak göstersem oh ne güzel mi dersiniz? O grafik nasıl anlamsızsa bu da anlamsız.