

Attribution of 2023 and 2024 anomalous warmth. Light blue bars show individual factors and their uncertainties, the dark blue bar shows the combined effects and combination of uncertainties and the red bar shows the actual warming compared with expectations. Adapted from Figure 12 in WMO’s state of the global climate 2024 report.
It is important to note that the first bar includes both El Niño and natural year-to-year variability; the height of the bar reflects the best estimate of El Niño’s effects, while the uncertainty range encompasses year-to-year variability in global temperatures that may be – at least in part – unrelated to El Niño.
Large natural variability to the Earth’s climate is one of the main reasons why the combined value of the different drivers of expected warmth in 2023 has an uncertainty range that exceeds the observed warming – even though the best-estimate of combined factors only explains half of temperatures.
Or, to put it another way, there is up 0.15°C difference in global temperatures year-on-year that cannot be explained solely by El Niño, human-driven global warming, or natural “forcings” – such as volcanoes or variations in solar output.
The figure below shows the difference between actual and expected warming in the global temperature record for every year in the form of a histogram. The vertical zero line represents the expectation given long-term global warming and the other vertical lines indicate the warming seen in 2023, 2024 and 2025.
The height of each blue bar represents the number of years over 1850-2024 when the average global temperature was that far (above or below) the expected level of warming.
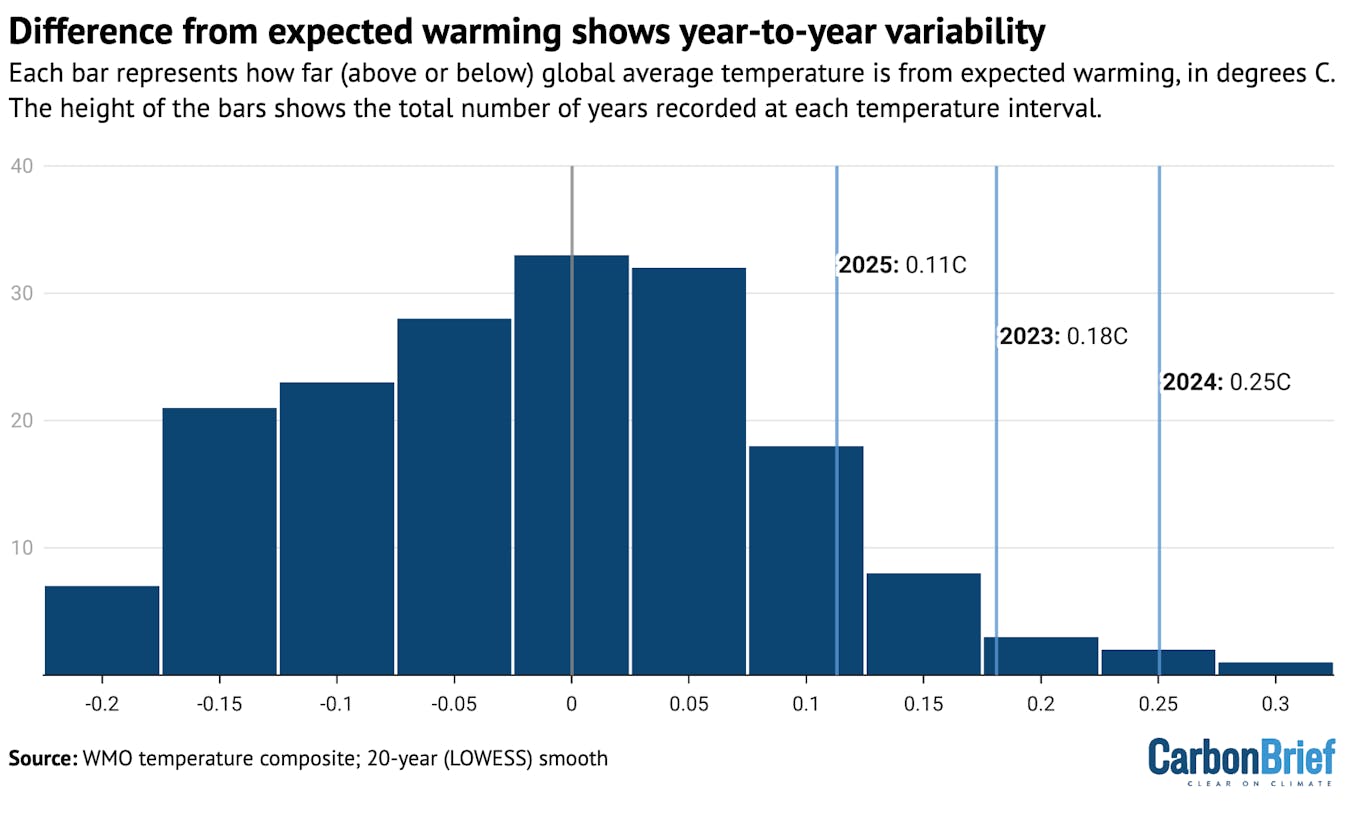
Histogram of residuals between actual and expected warming for all years since 1850, with the values for the past three years highlighted. Expected warming based on a 20-year locally linear smooth of the data.
Based on the range of year-to-year variability, temperatures would be expected to spike as far above the long-term trend as they did in 2023 once every 25 years, on average. The year 2024 would be a one-in-88 year event, whereas 2025 would be a less-unusual, one-in-seven year event.
These likelihoods for the past three years are sensitive to the approach used to determine what the longer-term warming level should be.
In this analysis, Carbon Brief used a local smoothing approach (known as locally estimated scatterplot smoothing) to determine the expected temperatures, following the approach used in the WMO “state of the climate 2024” report.
This approach results in a warming of 1.28°C in 2023 and 1.30°C in 2024, against which observed temperatures are compared.
Other published estimates put the longer-term warming in 2024 notably higher.
Last year, the scientists behind the “Indicators of Global Climate Change” (IGCC) report estimated that human activity caused 1.36°C of recent warming in 2024. They also found a slightly lower overall warming level for 2024 – 1.52°C, as opposed to the WMO’s 1.55°C – because they looked exclusively at datasets used by IPCC AR6. (This meant estimates from the Copernicus/ECMWF’s ERA5 dataset were not included.)
Based on climate simulations, the IGCC report finds the likelihood of 2024’s warmth to be a one-in-six year event and 2023’s a one-in-four event.
Using the same assumptions as the IGCC, Carbon Brief’s approach calculates that 2024 would be a less-common, one-in-18 year event.
However, the IGCC estimate of current human-induced warming is based on the latest estimates of human and natural factors warming the climate. That means that it already accounts for additional warming from low-sulphur shipping fuel, East Asian aerosols and other factors discussed above.
Therefore, the results from these two analyses are not necessarily inconsistent: natural climate variability (including El Niño) played a key role – but this came in addition to other factors. Natural fluctuations in the Earth’s climate alone would have been unlikely to result in the extreme global temperatures seen in 2023, 2024 and 2025.
A cloudy picture
Even if unusual recent global warmth can be mostly attributed to a combination of El Niño, falling SO2 emissions, the Hunga Tonga-Hunga Ha’apai volcano, solar cycle changes and natural climate variability, there are a number of questions that remain unanswered.
Most important is what the record warmth means for the climate going forward. Is it likely to revert to the long-term average warming level, or does it reflect an acceleration in the underlying rate of warming – and, if so, what might its causes be?
As explained by Carbon Brief in a 2023 article, climate models have suggested that warming will speed up. Some of this acceleration is built into the analysis presented here, which includes a slightly faster rate of warming in recent years than has characterised the period since 1970.
But there are broader questions about what – beyond declining SO2 and other aerosols – is driving this acceleration.
Research recently published in the journal Science offered some potential clues. It found a significant decline in planetary reflectivity – known as albedo – over the past decade, associated with a reduced low-level cloud cover that is unprecedented in the satellite record.
The authors suggest it could be due to a combination of three different factors: natural climate variability, changing SO2 and other aerosol emissions and the effects of global warming on cloud reflectivity.
Natural climate variability seems unlikely to have played a major role in reduced cloud cover, given that it was relatively stable until 2015. However, it is hard to fully rule it out given the relatively short satellite record.
Reductions in SO2 emissions are expected to reduce cloud reflectivity, but the magnitude of the observed cloud reflectivity changes are much larger than models simulate.
Models might be underestimating the impact of aerosols on the climate. But, if this were the case, it would indicate that climate sensitivity might be on the higher end of the range of model estimates, because models that simulate stronger aerosol cooling effects tend to have higher climate sensitivity.
Finally, cloud cover might be changing and becoming less reflective as a result of warming. Cloud responses to climate change are one of the largest drivers of uncertainty in future warming. One of the main reasons that some climate models find a higher climate sensitivity is due to their simulation of less-reflective clouds in a warming world.
The Science study concludes that the 2023 heat “may be here to stay” if the cloud-related albedo decline was not “solely” caused by natural variability. This would also suggest the Earth’s climate sensitivity may be closer to the upper range of current estimates, it notes.
Methodology
Carbon Brief built on work previously published in the IGCC 2024 and WMO state of the global climate 2024 reports that explores the role of different factors in the extreme temperatures in 2023, 2024 and 2025.
The impact of El Niño Southern Oscillation (ENSO) on the temperatures was estimated using a linear regression of the annual mean global temperature anomaly on the Feb/Mar Niño 3.4 index. This resulted in an impact of −0.07°C, 0.01°C and 0.13°C for 2022, 2023 and 2024 respectively (with a 95 per cent confidence interval of ±0.13 º°C).
It is important to note that the uncertainties in the ENSO response estimated here also incorporate other sources of unforced internal (modes of variability in other basins such as AMV), and potentially some forced variability. The bar in the combined figure is labelled “El Niño and variability” to reflect this.
For details on calculations of the temperature impact of shipping and Chinese SO2 declines, see Carbon Brief’s explainer on the climate impact of changing aerosol emissions.
Solar cycle 25 was both slightly earlier and slightly stronger than prior expectations with a total solar irradiance anomaly of 0.97 watts per metre squared in 2023 relative to the mean of the prior 20 years. This resulted in an estimated radiative forcing of approximately 0.17 watts per metre squared and an estimated global surface temperature increase of 0.07°C (0.05°C to 0.10°C) with a one- to two-year lag based on a 2015 study. Thus, the impact on 2023 and 2024 is around 0.04°C and 0.07°C, respectively (+/- 0.025°C). This is a bit higher warming than is given by the FaIR model, as the 2015 study is based on global models that have ozone responses to the UV changes, which amplifies the temperature effects a bit.
The Hunga Tonga-Hunga Haʻapai volcanic eruption added both SO2 and water vapour to the stratosphere (up to 55km in altitude). The rapid oxidation of SO2 to sulphate aerosol dominated the radiative forcing for the first two years after the eruption. As a result, the net radiative forcing at the tropopause was likely negative; −0.04 watts per metre squared and −0.15 watts per metre squared in 2022 and 2023, respectively, implying a temperature impact of -0.02°C (-0.01°C to -0.03°C) calculated using the FaIR model.
This story was published with permission from Carbon Brief.