Inflation-adjusted incomes are up across the board. People at every point of the income distribution can afford more real goods and services than ever before. Poverty after taxes and transfers is down.
Yet people are absolutely enraged because of higher gains made by somebody else. This obsession with income inequality is basically a manifestation of jealousy.
GOT_Wyvern on
It would have been nice if this included the 40th, 60th, and 80th percentiles as well. Without them, it’s hard to discern at what point after the median the United States is really serving. Income growth being great for the top 40% is very different than if it’s only great for the top 10%.
lord_ne on
A log scale would be nice so we could compare the percent change of each percentile
cobrachickenwing on
Just shows how the winners of the bailouts are the ultra wealthy. Their incomes went up double digits while the rest did not even beat inflation.
CorrectCombination11 on
Inflation adjusted to 1990 dollars? Just trying to clarify.
Danph85 on
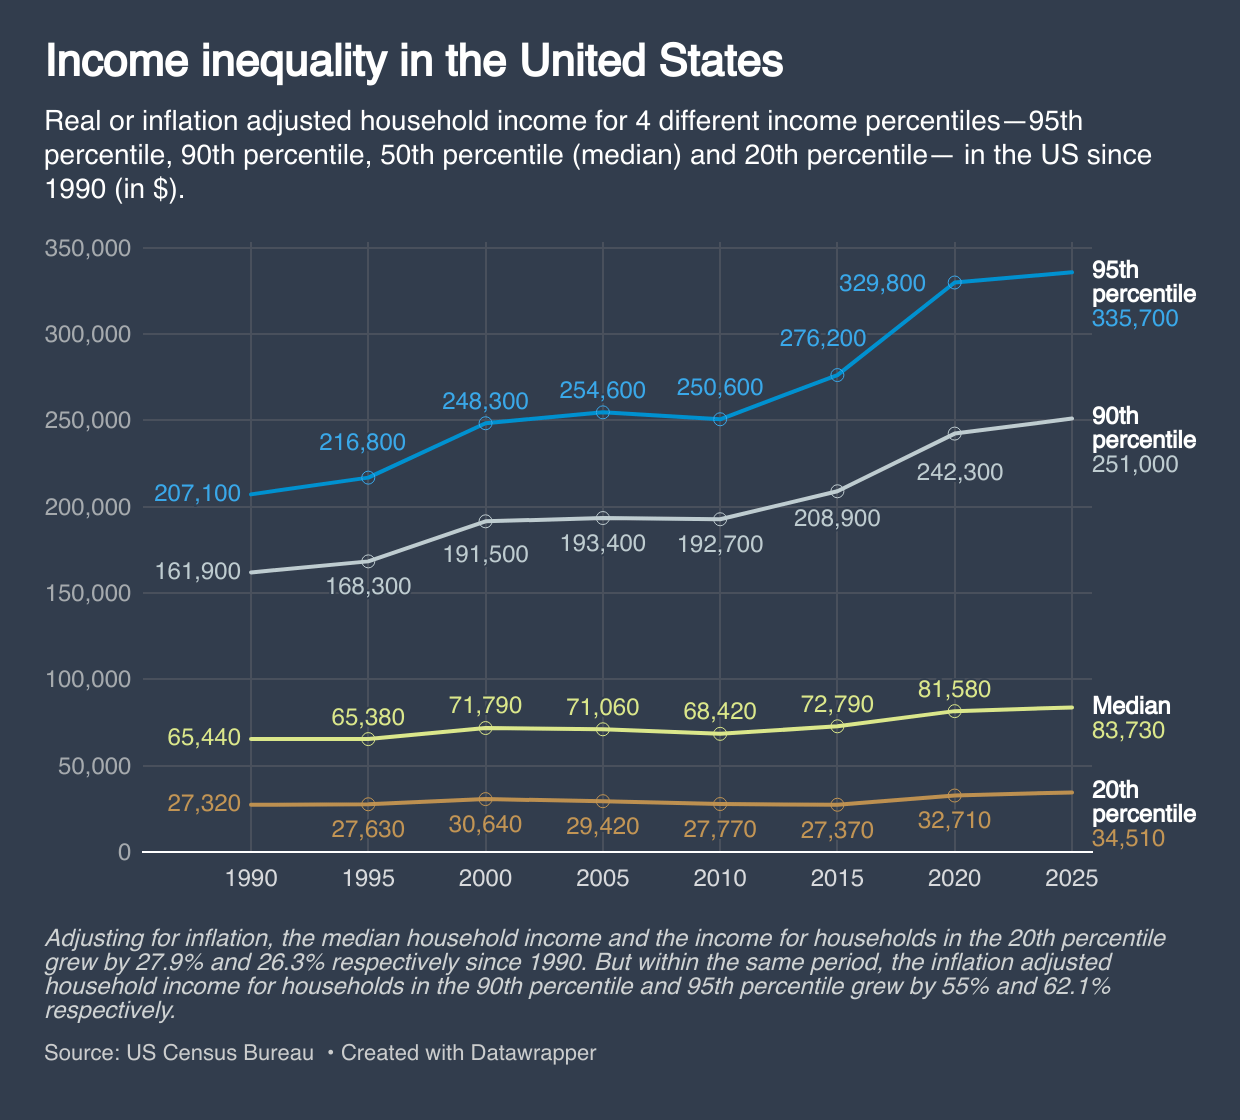
So in 1990 95th percentile was 7.58x higher than 20th, and 3.13x higher than median. Now it’s 9.72x and 4.00x. So 95% percentile has grown 28.3% faster than 20th percentile in that time, and 26.6% faster than median.
SonnySwanson on
This comparison would be much more accurate if you compare income after taxes and include government welfare programs.
Bob_Sconce on
Will be interesting to see how these numbers change after Trump’s immigration crackdown. A lot of the people in the bottom quintile are recent immigrants who are doing much better than they were in their home country, but are at the bottom here. In the past, they have tended to displace native-born Americans who move up to higher quintiles. Without them, those native-born people will be in the lowest quintile, but the average wage of that quintile should increase.
Pensive_1 on
Census data is gross household income.
Add in the diminished effects of taxes on the gross (to yield net take home) and you’ll see it’s much flatter.
ketosoy on
What year’s dollars is this adjusted to?
first_time_internet on
So i am in the mid 100s and still just above 50%? Dang. I feel like I am in the 80% at least, but maybe it is because I am not laden with debt

![[OC] Income inequality in the United States](https://www.byteseu.com/wp-content/uploads/2026/01/xyd5fnirb4cg1-1024x925.png "[OC] Income inequality in the United States")
12 Comments
Source: [US Census Bureau ](https://www2.census.gov/library/publications/2025/demo/p60-286.pdf)
Tools: [Datawrapper ](https://www.datawrapper.de/)
Inflation-adjusted incomes are up across the board. People at every point of the income distribution can afford more real goods and services than ever before. Poverty after taxes and transfers is down.
Yet people are absolutely enraged because of higher gains made by somebody else. This obsession with income inequality is basically a manifestation of jealousy.
It would have been nice if this included the 40th, 60th, and 80th percentiles as well. Without them, it’s hard to discern at what point after the median the United States is really serving. Income growth being great for the top 40% is very different than if it’s only great for the top 10%.
A log scale would be nice so we could compare the percent change of each percentile
Just shows how the winners of the bailouts are the ultra wealthy. Their incomes went up double digits while the rest did not even beat inflation.
Inflation adjusted to 1990 dollars? Just trying to clarify.
So in 1990 95th percentile was 7.58x higher than 20th, and 3.13x higher than median. Now it’s 9.72x and 4.00x. So 95% percentile has grown 28.3% faster than 20th percentile in that time, and 26.6% faster than median.
This comparison would be much more accurate if you compare income after taxes and include government welfare programs.
Will be interesting to see how these numbers change after Trump’s immigration crackdown. A lot of the people in the bottom quintile are recent immigrants who are doing much better than they were in their home country, but are at the bottom here. In the past, they have tended to displace native-born Americans who move up to higher quintiles. Without them, those native-born people will be in the lowest quintile, but the average wage of that quintile should increase.
Census data is gross household income.
Add in the diminished effects of taxes on the gross (to yield net take home) and you’ll see it’s much flatter.
What year’s dollars is this adjusted to?
So i am in the mid 100s and still just above 50%? Dang. I feel like I am in the 80% at least, but maybe it is because I am not laden with debt