
 Valuation After Blockchain Lending And Rate Cut Enthusiasm")
Figure Technology Solutions (FIGR) is back in the spotlight after its shares reached fresh highs, helped by expectations of further Federal Reserve rate cuts and heightened attention on its new blockchain lending initiatives.
See our latest analysis for Figure Technology Solutions.
The recent buzz around Figure’s RWA Consortium, Solana based stablecoin launch and rate cut expectations has coincided with strong momentum, with a 7 day share price return of 32.78% and a 30 day share price return of 46.11%, while the 90 day share price return of 37.47% suggests interest has been building rather than fading.
If this kind of fintech momentum has your attention, it could be a good time to see which other names are moving in high growth tech and AI stocks.
With FIGR now above its average analyst target and trading near recent highs, the key question is whether the current price already reflects its blockchain lending story and expectations for potential rate cuts, or if the market is still underpricing future prospects.
Price-to-Sales of 32.5x: Is it justified?
Figure Technology Solutions is trading on a P/S ratio of 32.5x, which sits against a last close of US$58.08 and points to a rich valuation compared with peers.
P/S compares a company’s market value with its revenue, so a higher multiple usually means investors are paying more for each dollar of sales. For a fintech name like FIGR that is focused on blockchain based lending, trading and investing platforms, a premium P/S can often reflect expectations for strong top line expansion rather than current earnings power.
Here, the Statements Data flags that FIGR is expensive based on its 32.5x P/S against both the US Consumer Finance industry average of 1.6x and a peer average of 2.3x. That kind of gap suggests the market is pricing in a very optimistic revenue path and profitability profile rather than treating FIGR like a typical consumer finance stock.
The comparison is stark: FIGR’s P/S multiple is more than 20x the industry average and well above the peer group level. This clearly places the stock at the high end of the sector’s valuation range.
See what the numbers say about this price — find out in our valuation breakdown.
Result: Price-to-Sales of 32.5x (OVERVALUED)
However, there are clear risks here, including execution around the blockchain lending rollout and the chance that rate cut expectations or analyst targets prove too optimistic.
Find out about the key risks to this Figure Technology Solutions narrative.
Another View: What Our DCF Model Suggests
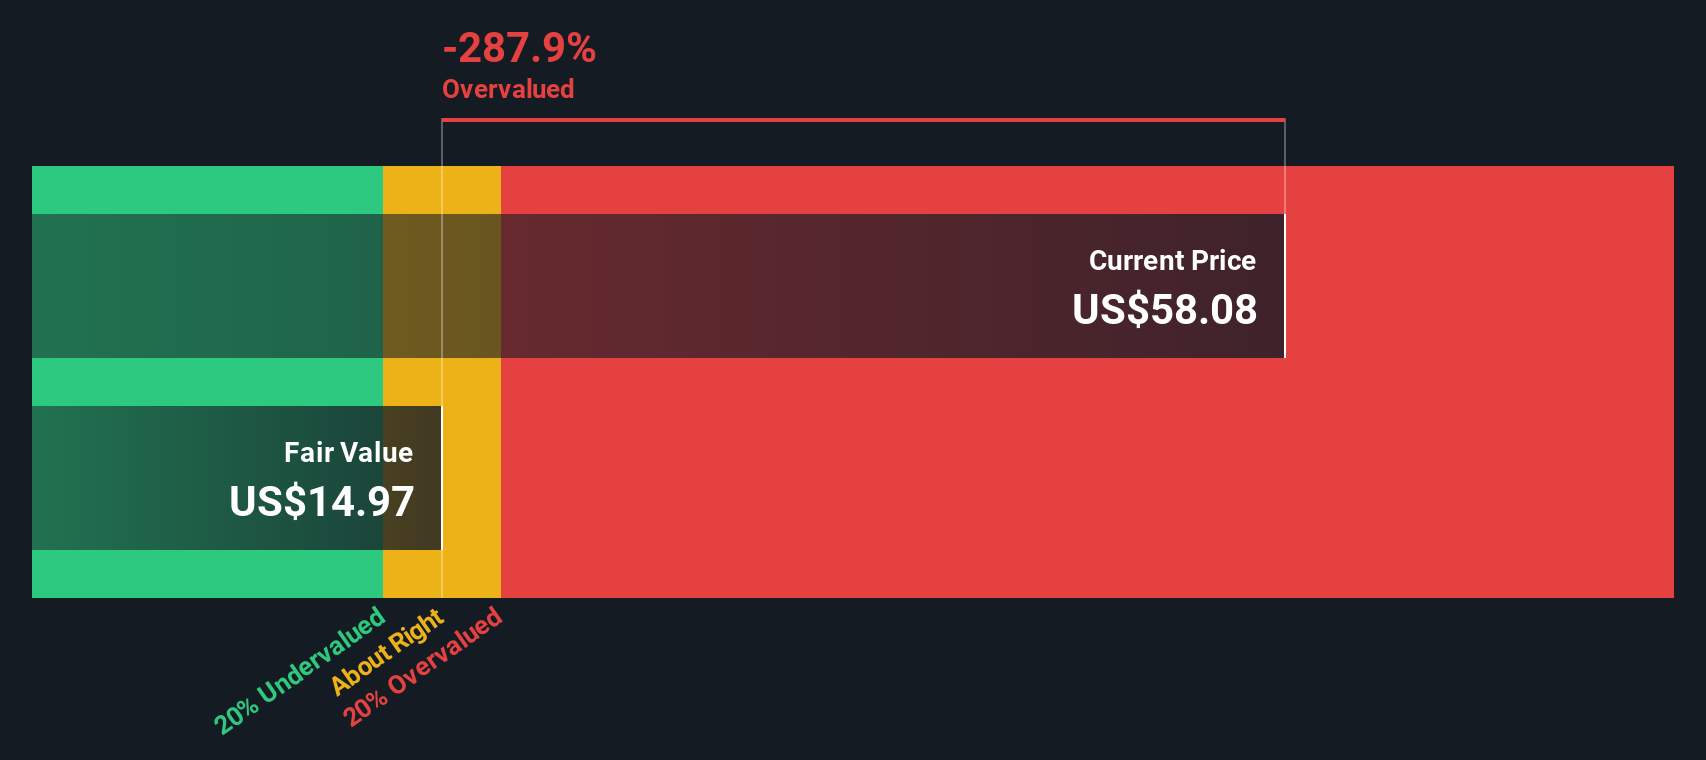
While the P/S ratio paints FIGR as expensive, our DCF model also points to a rich setup. FIGR trades at US$58.08 compared with an estimated fair value of US$14.97, which suggests the current price already bakes in a lot of optimism.
That kind of gap can cut both ways. The real question for you is whether the story justifies paying this much above our DCF number, or if expectations have simply run too far ahead.
Look into how the SWS DCF model arrives at its fair value.
 FIGR Discounted Cash Flow as at Jan 2026
Simply Wall St performs a discounted cash flow (DCF) on every stock in the world every day (check out Figure Technology Solutions for example). We show the entire calculation in full. You can track the result in your watchlist or portfolio and be alerted when this changes, or use our stock screener to discover 877 undervalued stocks based on their cash flows. If you save a screener we even alert you when new companies match – so you never miss a potential opportunity.
Build Your Own Figure Technology Solutions Narrative
If you see the figures differently or prefer to rely on your own work, you can stress test the data and shape a custom view in minutes: Do it your way.
A great starting point for your Figure Technology Solutions research is our analysis highlighting 2 key rewards and 2 important warning signs that could impact your investment decision.
Looking for more investment ideas?
If FIGR has caught your eye, do not stop there. Use the Simply Wall St Screener to size up fresh opportunities that match your style and risk tolerance.
This article by Simply Wall St is general in nature. We provide commentary based on historical data
and analyst forecasts only using an unbiased methodology and our articles are not intended to be financial advice. It does not constitute a recommendation to buy or sell any stock, and does not take account of your objectives, or your
financial situation. We aim to bring you long-term focused analysis driven by fundamental data.
Note that our analysis may not factor in the latest price-sensitive company announcements or qualitative material.
Simply Wall St has no position in any stocks mentioned.
Our new AI Stock Screener scans the market every day to uncover opportunities.
• Dividend Powerhouses (3%+ Yield)
• Undervalued Small Caps with Insider Buying
• High growth Tech and AI Companies
Or build your own from over 50 metrics.
Have feedback on this article? Concerned about the content? Get in touch with us directly. Alternatively, email editorial-team@simplywallst.com