
![[OC] My Expected Weight Using CICO During a Diet was Astoundingly Accurate](https://www.byteseu.com/wp-content/uploads/2026/01/j90at4ikz0fg1-1313x1536.png "[OC] My Expected Weight Using CICO During a Diet was Astoundingly Accurate")
Abstract (TL;DR)
Energy balance (calories in vs calories out; CICO) predicts that body weight should change in proportion to sustained caloric deficit, but real-world accuracy is often disputed due to error in intake and expenditure estimates and day-to-day weight volatility.
I tracked two cuts (2018 and 2020) using a custom Google Sheets model driven by daily calorie intake (MyFitnessPal), activity calories (Fitbit HR), and BMR estimates (Mifflin–St Jeor; Katch–McArdle), with both fixed activity-multiplier TDEE and a trend-based adaptive TDEE derived from 10-day moving averages.
In the 2018 cut, weight decreased from 200.7 to 174.5 lb over ~120 days (~26 lb), and the CICO-based predicted trajectory closely tracked observed weight when using BMR plus tracker-estimated activity; a fixed “Active” TDEE multiplier (1.55) diverged after ~50–60 days, coinciding with a sustained drop in activity calories and an increase in average intake, while the adaptive TDEE remained closely aligned. The end-of-cut error in total predicted loss vs total observed loss was 2.21 lb (MSJ), 3.56 lb (Katch–McArdle), 7.20 lb (fixed TDEE), and -0.31 lb (adaptive TDEE), corresponding to 91.13%, 85.72%, 71.18%, and 98.77% accuracy when normalized to total weight lost.
In the shorter 2020 cut, end-of-cut error in total predicted loss vs total observed loss was 1.28 lb (MSJ), 2.09 lb (Katch–McArdle), 0.91 lb (fixed TDEE), and 0.57 lb (adaptive TDEE), corresponding to 80.20%, 67.63%, 85.92%, and 91.15% accuracy when normalized to total weight lost.
These results support the practical validity of CICO when inputs are tracked consistently, and suggest that adaptive, trend-based TDEE estimation can outperform static activity multipliers, especially when behavior changes during a cut; shorter datasets appear “less accurate” primarily because measurement noise constitutes a larger fraction of total weight change.
Introduction
People usually agree with CICO in theory, but in practice you’ll see arguments like: “calories aren’t accurate,” “trackers are wrong,” “3,500 calories per pound is a myth,” or “water weight makes it impossible to measure.” Most of those criticisms aren’t really about whether energy balance is real — they’re about whether you can measure the inputs accurately enough to predict outcomes.
So I treated this like a personal experiment: track intake and activity consistently, smooth out daily scale noise, and see how closely a CICO-driven model predicts real-world weight change across a long cut (2018) and a shorter cut (2020). The goal here isn’t to claim perfect precision in every setting — it’s to show what happens when you are consistent, and what breaks when assumptions (like a fixed activity multiplier) stop matching behavior.
Setup
As most people who have researched weight loss know, weight loss is driven by energy balance: if you burn more calories than you consume over time, you lose weight.
I wanted to test a few things:
- How close the “3,500 calories ≈ 1 lb” rule gets in practice
- How accurate food logging can be (CI)
- How accurate fitness trackers are at estimating calories burned (CO)
- How accurate bathroom scales can be when you look at trends instead of day-to-day noise
So in 2018, when I needed to lose ~25 lb, I created a Google Sheets spreadsheet to track everything. Every morning I weighed myself and logged:
- body weight (morning weigh-in)
- the previous day’s calories consumed (CI) tracked in MyFitnessPal
- the previous day’s activity calories (CO) estimated by a Fitbit HR I wore 24/7
In 2020, I used the same sheet again when I put on some weight recovering from an injury (grade 2 pulled hamstring).
How the sheet works (and how it evolved)
It started simple:
- estimate BMR (Basal Metabolic Rate) using height, age, sex, and body weight
- add Fitbit’s estimated activity calories
- compute daily net calories
- Net vs BMR = CI − (BMR + activity calories)
I also compared this to the traditional “TDEE multiplier” approach:
- TDEE = BMR × activity multiplier (e.g., 1.55 for “Active”)
- Net vs TDEE = CI − TDEE
Then I expanded it:
- convert net calories to estimated pounds lost using 3,500 calories per lb
- sum deficits over time → cumulative estimated loss
- starting weight − estimated loss → estimated weight each day
- estimate when I’d hit my goal based on predicted rate and actual rate
Over time I added graphs and trendlines. And as the cut went longer, the predictions became noticeably more stable because the noise averaged out.
Current (why I’m revisiting this now)
This winter I did a bulk where I gained about 30 lb over ~5 months for two reasons:
- Strength goals (1,250 lb club; 3/4/5 plates: bench/squat/deadlift)
- Putting on more muscle mass
Once I hit those goals (deadline Feb 1), I’m going to cut down to ~12% body fat.
For that upcoming cut I’ll be using the sheet again, and I’ve improved it further.
What’s new in the updated sheet
Moving Averages tab
Instead of basing everything on daily weight (which is volatile), the core calculations are based on:
- 10-day moving average and weighted 10-day moving average of:
- weight
- body fat %
- calories consumed (CI)
- calories burned/activity calories (CO)
This tab also includes:
- “days from start” estimates to hit the goal using multiple models
- implied daily deficit based on the observed trend
- implied TDEE (CI + implied deficit)
- moving TDEE multiplier (implied TDEE ÷ BMR), so the activity multiplier adapts instead of staying fixed at something like 1.55
Data tab updates
- added Adaptive/Implied TDEE
- added a second BMR estimate based on body composition (Katch–McArdle) using body fat % from my scale (I’m aware BIA isn’t perfect; I’m using it as a trending tool)
The Sheet
Data
This is large because it includes my longer 2018 diet (about 120 days). If you want, you can scan it to see how each estimate is computed, but here are the high-level results.
2018 results
- Start: 200.7 lb
- End: 174.5 lb
- Total loss: 24.97 lb
- Lean mass loss: 7.30 lb
- Fat loss: 17.67 lb
- Percent of loss from fat: 70.77%
2020 results
- Total loss: 6.46 lb
- Lean mass loss: 2.28 lb
- Fat loss: 4.18 lb
- Percent of loss from fat: 64.78%
Quick note: the lean/fat split is based on scale body-fat estimates, so I wouldn’t treat the exact numbers as lab-grade, but it’s still useful directionally especially over many measurements.
Moving Avgs
The Moving Avgs tab contains both standard 10-day moving averages and weighted moving averages that respond faster to changes. This is the tab that makes the graphs and the “days-to-goal” estimates behave much better, because it reduces day-to-day noise.
You can also see clearly that the cut started stronger than it ended. In the 2018 cut, the “days-to-goal” estimates initially suggested a much faster finish, then drifted upward as my average deficit decreased.
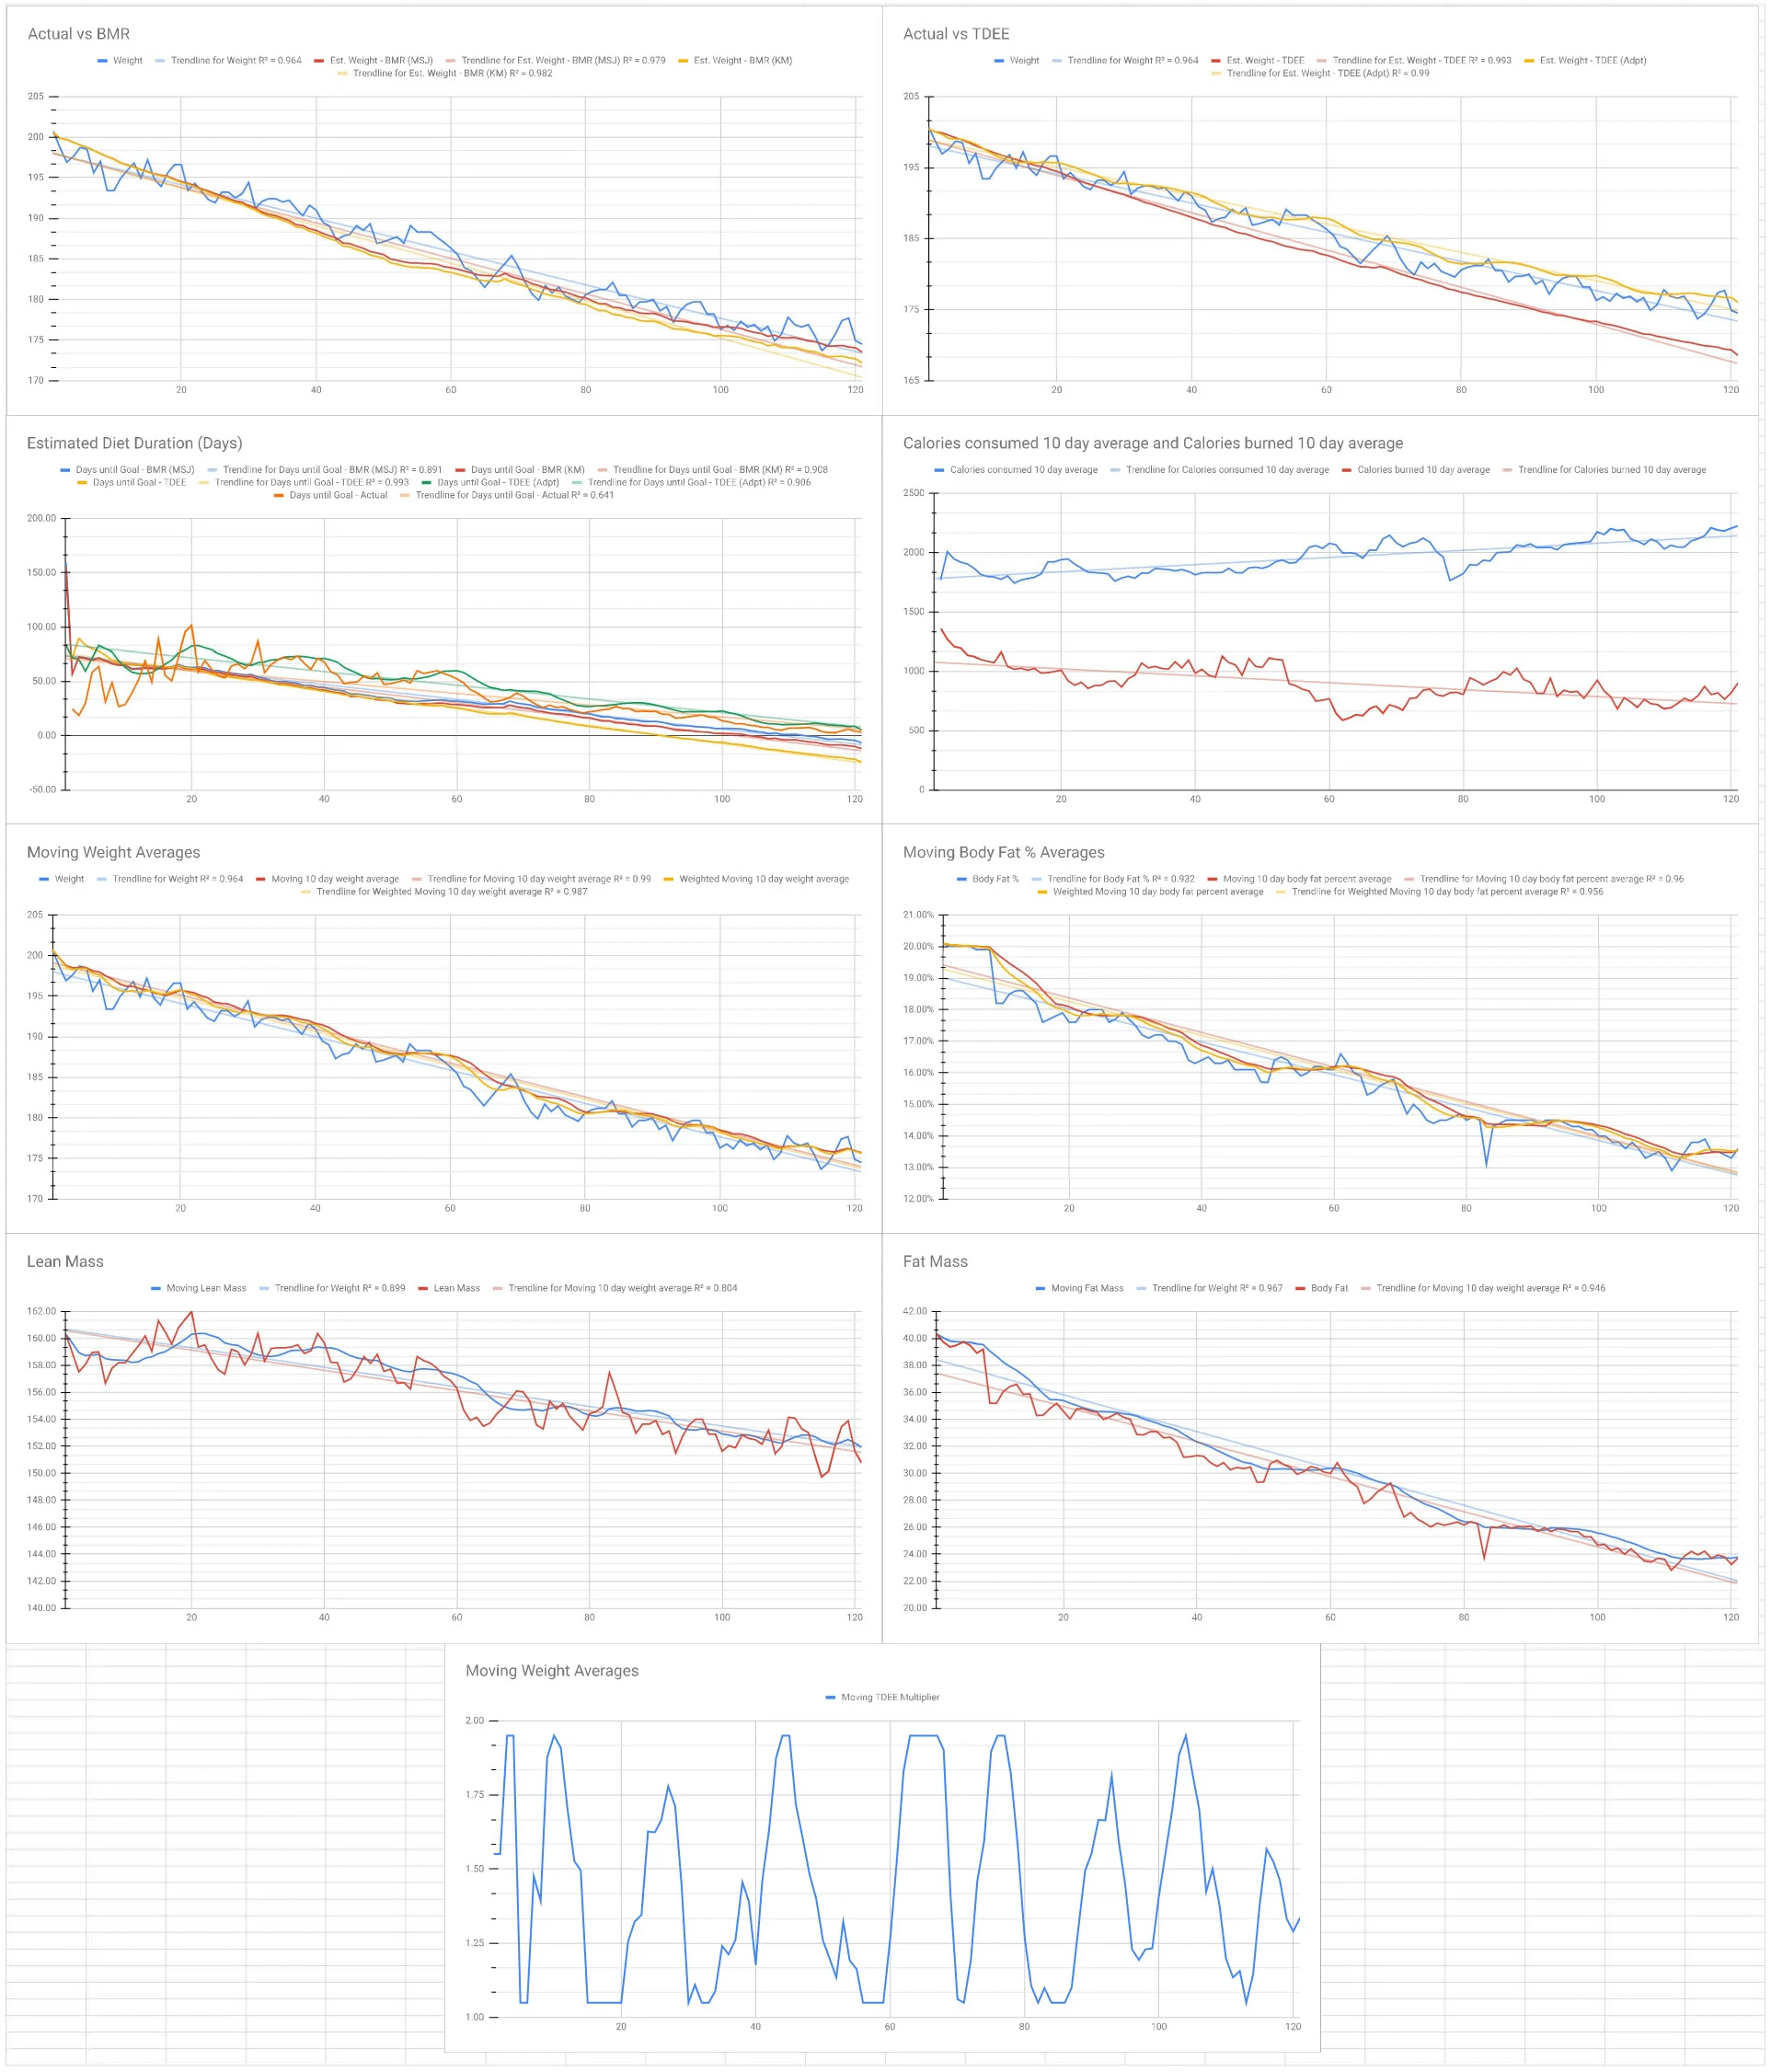
Graphs
This is where the story becomes obvious.
- Actual vs predicted weight: “BMR + tracker activity” tracks very closely. Static TDEE multiplier starts close and then drifts after ~50–60 days. Adaptive TDEE stays closely aligned.
- Diet duration estimate: The trend-based estimates track reality much more closely once enough data accumulates.
- CI and CO trend: You can clearly see why fixed-multiplier TDEE broke: activity calories dropped and stayed lower, while average intake rose compared to earlier in the cut.
- Moving averages: These remove most of the scale volatility and make the underlying trend visible.
- Moving TDEE multiplier: It’s volatile even with moving averages, but it still converges to something very useful and ends up producing strong end-of-cut predictions.
Static Vars / Stats tab
And finally we come to the last tab: the Static Vars / Stats tab. In green at the top is where the user enters personal information (birthday, height, sex, goal weight, and activity level). Below that are the fixed conversions/constants the sheet uses (imperial↔metric conversions, activity multipliers, etc.).
In the center is the summary block I used during the cut to sanity-check the trend:
- Overall averages (entire diet): average calories consumed, average active calories burned, and the average net calories using each model (BMR-based and TDEE-based), plus the implied average weekly loss rate. Example from the 2018 cut: ~1971 calories consumed/day, ~887 active calories/day, and ~1.52 lb/week average loss.
- Last 7 days: the same stats but restricted to the last week, which is useful mid-diet to see whether you’re currently trending faster or slower than the full-diet average.
At the bottom are the totals: total weight lost, remaining to goal, progress %, and the lean mass vs fat mass split (based on the scale’s body fat %), plus the end-of-cut error/accuracy stats comparing each model.
Accuracy
Here’s the definition I’m using for how accurate the estimations were:
- Absolute error (lb) = |predicted total loss − actual total loss|
- Accuracy % (of weight lost) = 1 − (absolute error ÷ actual weight lost)
2018 accuracy (end-of-cut error in total predicted loss vs observed loss)
Absolute error (lb):
- BMR (MSJ): 2.21
- BMR (KM): 1.97
- TDEE (fixed): 7.20
- TDEE (adaptive): -0.31 (i.e., essentially dead-on)
Accuracy % (normalized to total weight lost):
- BMR (MSJ): 91.13%
- BMR (KM): 92.13%
- TDEE (fixed): 71.18%
- TDEE (adaptive): 98.77%
2020 accuracy
Absolute error (lb):
- BMR (MSJ): 1.28
- BMR (KM): 2.09
- TDEE (fixed): 0.91
- TDEE (adaptive): 0.57
Accuracy % (normalized to total weight lost):
- BMR (MSJ): 80.20%
- BMR (KM): 67.63%
- TDEE (fixed): 85.92%
- TDEE (adaptive): 91.15%
Why 2020 looks less accurate
The 2020 cut is shorter and involves much less total weight change. That makes the same absolute error look much worse as a percentage.
A 1 lb miss on a ~25 lb cut is ~4% error, but a 1 lb miss on a ~6 lb cut is ~16% error — even if your tracking is equally “good.” Shorter datasets also give moving averages and adaptive methods less time to stabilize.
MSJ vs Katch–McArdle (what this suggests, and what I’m watching next)
One interesting pattern here is that Mifflin–St Jeor (MSJ) generally outperformed Katch–McArdle (KM) in these datasets (especially in 2020, where KM was the weakest of the four approaches). My guess is that during those cuts I had a relatively “normal” body type for what these population-based formulas assume, so MSJ was closer to my true baseline energy expenditure.
That said, I’m especially interested in whether this changes in my upcoming cut. I’m currently more muscular than I was in 2018/2020, and KM explicitly uses lean body mass (via body fat %) which should make it more sensitive to higher LBM. If KM starts outperforming MSJ in the next cut, that would be a useful real-world signal that body-composition-based BMR estimation becomes more valuable as you move away from average body composition.
(And if it doesn’t, that’s useful too — it would suggest that in practice the error in scale-derived body fat % may outweigh the theoretical advantage of the KM formula.)
DEXA validation (2018)
The two DEXA scans are important because they act like an external “ground truth” check on the two big things my sheet claims:
- The scale trend reflects real tissue change over the cut (not just random water-weight artifacts), and
- The “lean vs fat” split from the sheet is directionally correct, even if the daily BIA scale numbers aren’t perfectly calibrated.
DEXA measured 195.5 → 172.0 lb total mass (−23.5 lb) from July 5 (day 8) to Oct 27 (day after the diet). That matches what my daily weigh-ins showed: a large, sustained downward trend over the cut rather than “illusory” loss driven by short-term fluctuations. In other words, the scale trend wasn’t lying — the tissue change was real.
DEXA also gives the most credible estimate of what I lost: fat mass decreased 42.8 → 23.6 lb (−19.2 lb) and lean mass decreased 144.1 → 139.6 lb (−4.5 lb). That implies ~81.7% of the weight lost was fat and ~19.1% was lean, which supports the overall picture from the sheet (most loss was fat), but suggests the BIA-based split likely overestimated lean loss and/or underestimated fat loss. That’s exactly what you’d expect if you use a consumer BIA scale: it’s useful, but not lab-grade.
The DEXA scans also helped me interpret the BIA scale body-fat % readings correctly. On the final scan, the DEXA body fat % was just ~0.1 percentage points different from my BIA scale that day, but on the early scan it was off by about ~2 percentage points. That’s a good real-world reminder that with BIA scales, the trend matters more than the exact absolute number. The day-to-day (and even month-to-month) “true” calibration can drift, but if you measure the same way consistently, the signal over time is still highly informative — especially when you smooth it with moving averages.
Conclusion
CICO works with impressive real-world accuracy if you’re diligent and consistent with measurement. In two separate cuts, my predicted final weight ended up within about a pound of my actual final weight using the 3,500 calories per lb conversion.
Yes, this is n=1 (or n=2), but with results this tight, I’m comfortable saying that energy balance is real, and for many people, “CICO doesn’t work” usually means “CI/CO wasn’t measured consistently enough,” not that physics stopped applying.
If you want to use the sheet, feel free. It’s free! Just open the Sheet and go to File > Make a copy.
Happy to answer questions or share how any of the formulas work.
I will add that this post was not AI written. I wrote a 1,500 word article and simply used AI to help structure it to be a little more readable.
Posted by Solmors
5 Comments
I could recommend spacing for legibility
Yea, I appreciate the work put into this, but I think most people agree that CICO works for most people. There are some exceptions but yeah. The issue is usually that people aren’t tracking accurately (weighing, logging, etc)
I am doing a similar thing, tracking weight loss for four weeks now. But I can’t work out how to do calories in. A salad has many ingredients, but even if I could calculate to value of the whole bowl, a meal, or sometimes a snack is a small portion of the overall bowl. So I just diet hard, exercise hard, and measure the weight and fat content.
>”A theory is the more impressive the greater the simplicity of its premises, the more different kinds of things it relates, and the more extended its area of applicability. Therefore the deep impression that classical thermodynamics made upon me. It is the only physical theory of universal content concerning which I am convinced that, within the framework of the applicability of its basic concepts, it will never be overthrown.”
— Albert Einstein
>”Nothing in life is certain except death, taxes, and the second law of thermodynamics.”
— Seth Lloyd
Saw the title and thought, “Yeah, that means you were exceptionally good at tracking your intake and burn.”
Opened up the post. “Yep.”