
![Who Owes What? U.S. Debt by Sector (2000–2025) [oc]](https://www.byteseu.com/wp-content/uploads/2026/01/wcy2nudqi0fg1-1536x1115.jpeg "Who Owes What? U.S. Debt by Sector (2000–2025) [oc]")
- Data: Federal Debt: Total Public Debt (Absolute $) — Total U.S. federal government debt outstanding https://fred.stlouisfed.org/series/GFDEBTN
- All Sectors; Debt Securities and Loans; Liability, Level — Total credit market debt across all sectors (households, corporates, etc.) https://fred.stlouisfed.org/series/TCMDO
Software used: GGPlot package in R
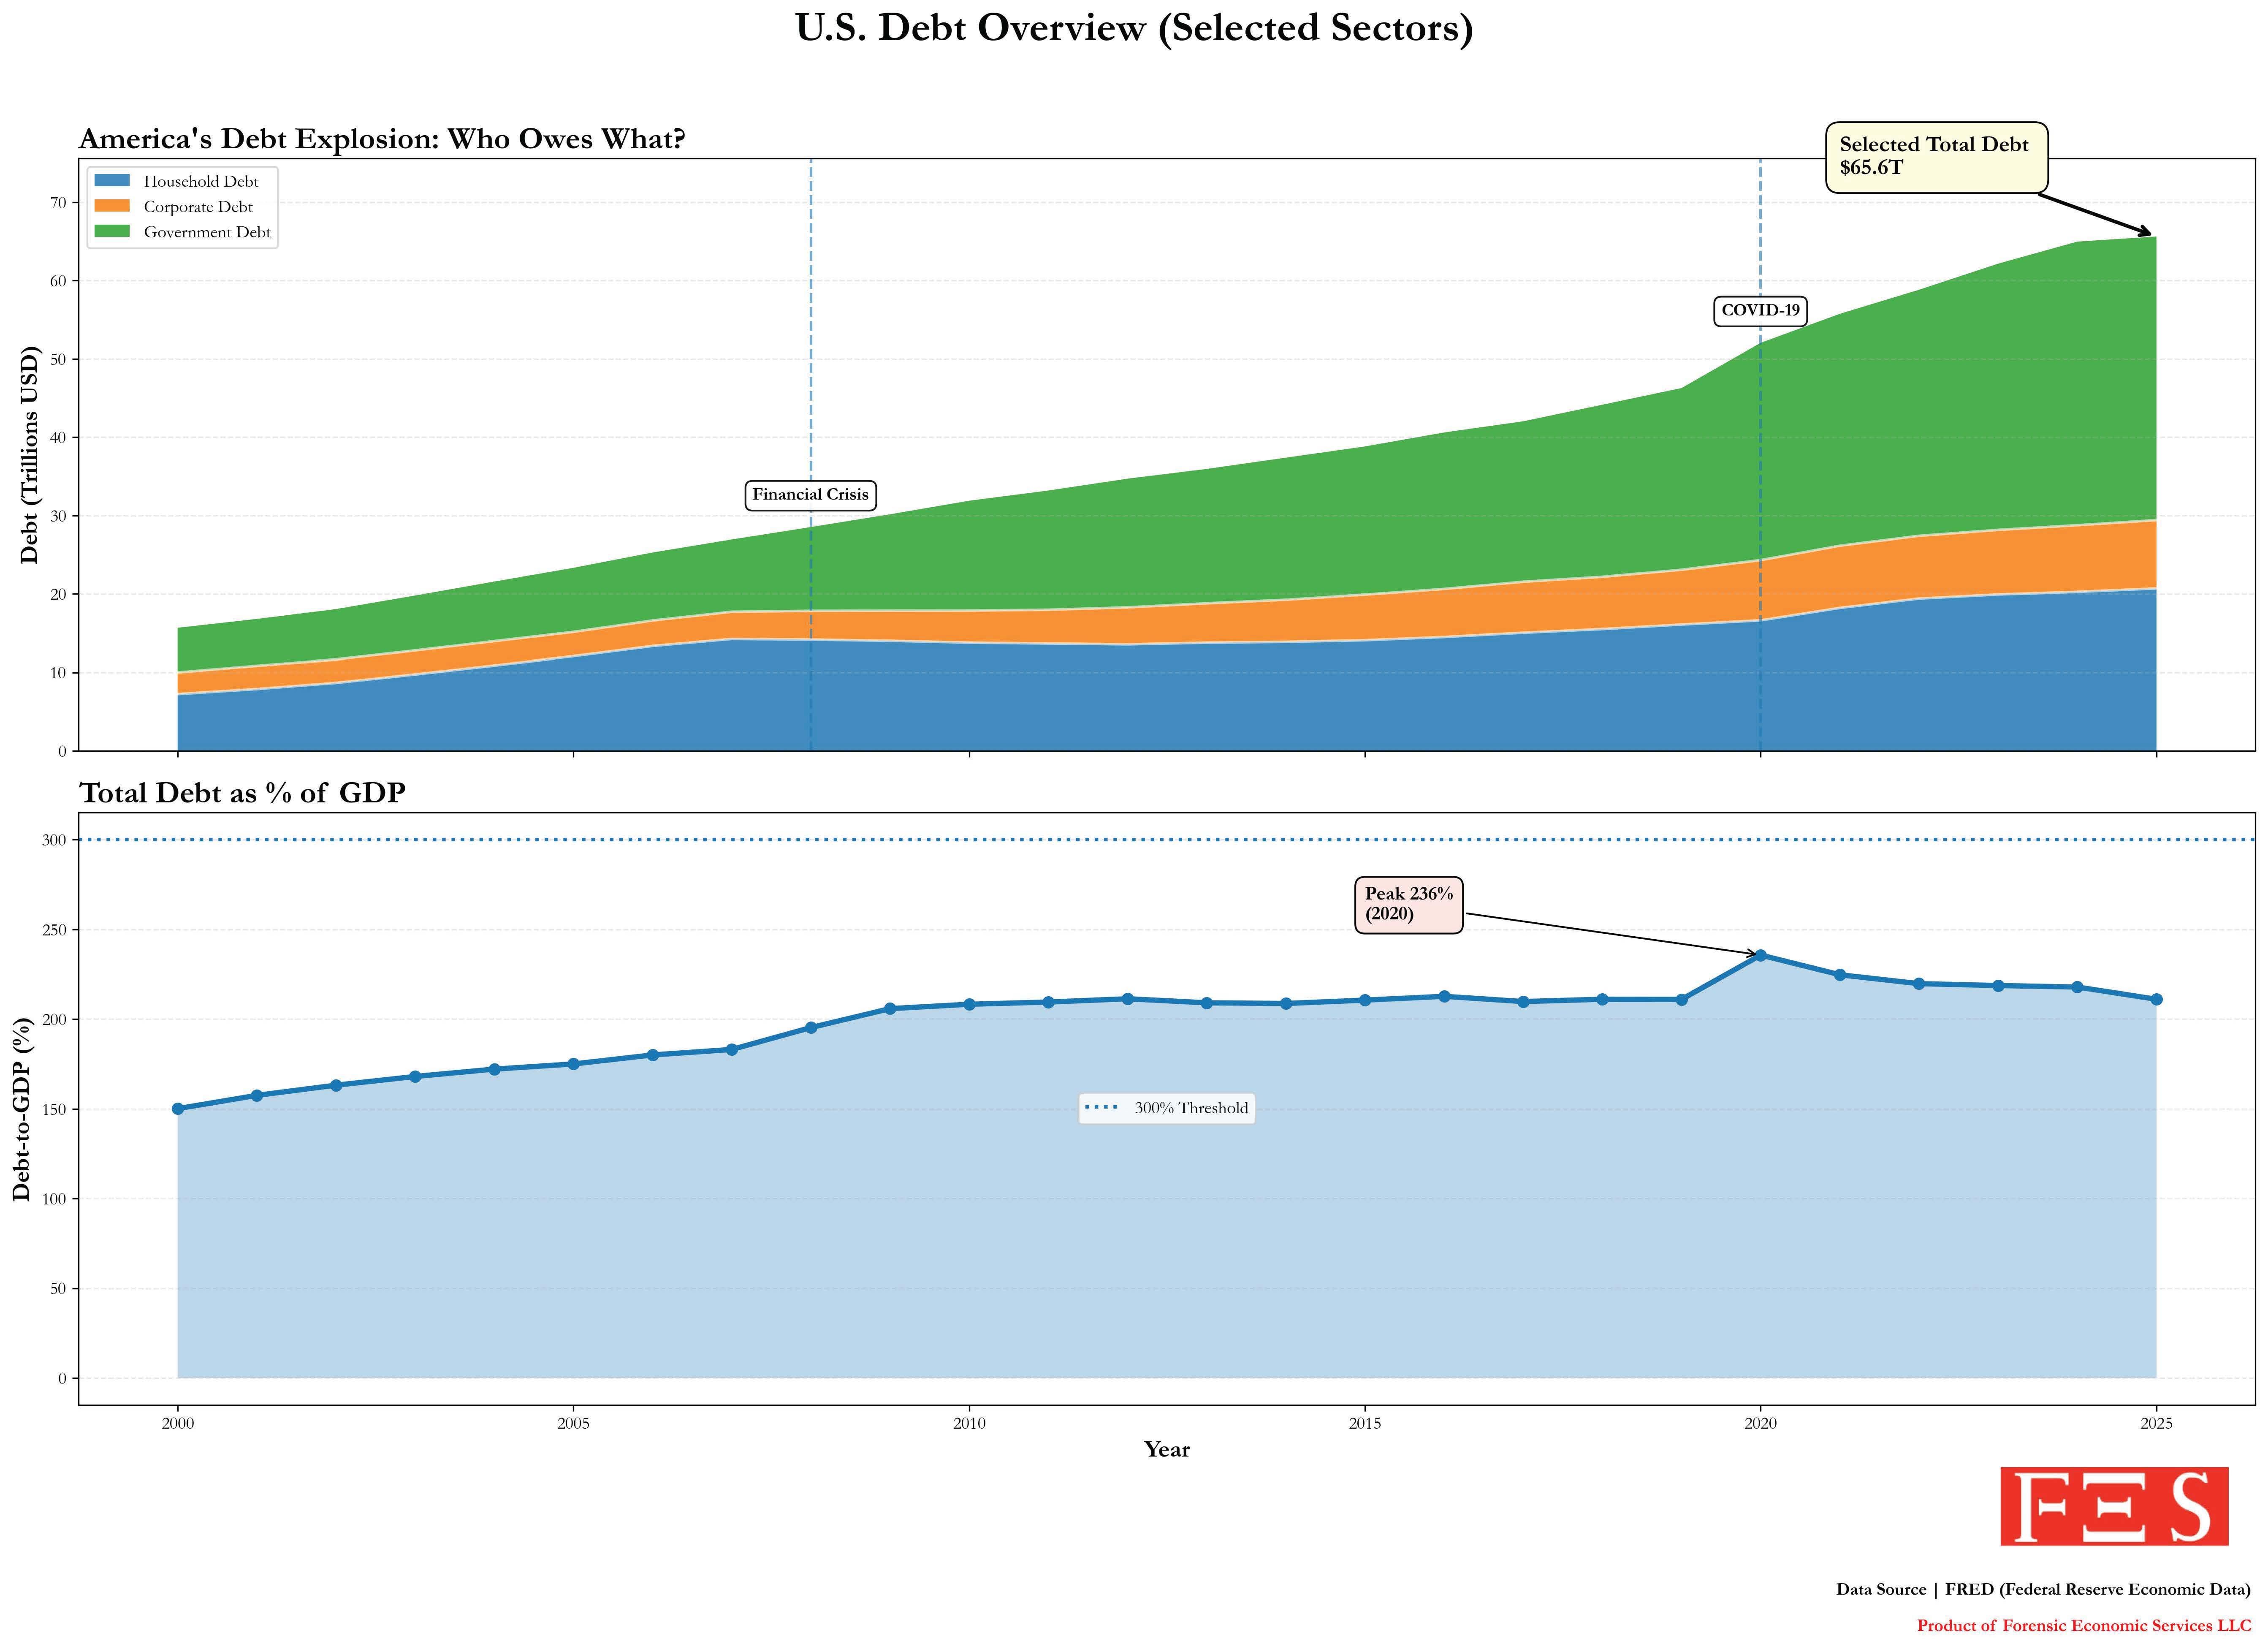
This visualization uses data from the Federal Reserve Economic Data (FRED) to show how U.S. debt has evolved across three major sectors: households, nonfinancial corporations, and the federal government (in trillions of USD). It also computes a selected-sector debt-to-GDP ratio by comparing the combined debt total to U.S. GDP.
Debt has risen steadily over time, with clear accelerations around the 2008 financial crisis and the 2020 COVID-19 shock. While total debt continued to grow after 2020, the debt-to-GDP ratio peaked that year and has since declined modestly as economic output recovered.
The chart provides a long-run view of leverage across sectors and how major economic shocks reshape balance sheets relative to overall economic capacity.
Posted by forensiceconomics
2 Comments
That’s a weird set of things to add up. Corporate debt is fundamentally nothing like personal debt, and nothing like government debt. And why would you exclude state and local debt?
Nice!
Board of Governors tracks that here too
[https://www.federalreserve.gov/releases/z1/dataviz/z1/nonfinancial_debt/chart/](https://www.federalreserve.gov/releases/z1/dataviz/z1/nonfinancial_debt/chart/)