
![[OC] Sales volatility in the video game industry](https://www.byteseu.com/wp-content/uploads/2026/01/cboacn052bfg1-1024x1024.png "[OC] Sales volatility in the video game industry")
Data: Quarterly reports of CD Projekt, Embracer Group, Paradox Interactive and 11 Bit Studios (2018-2025)*
Tools: Excel, PowerPoint
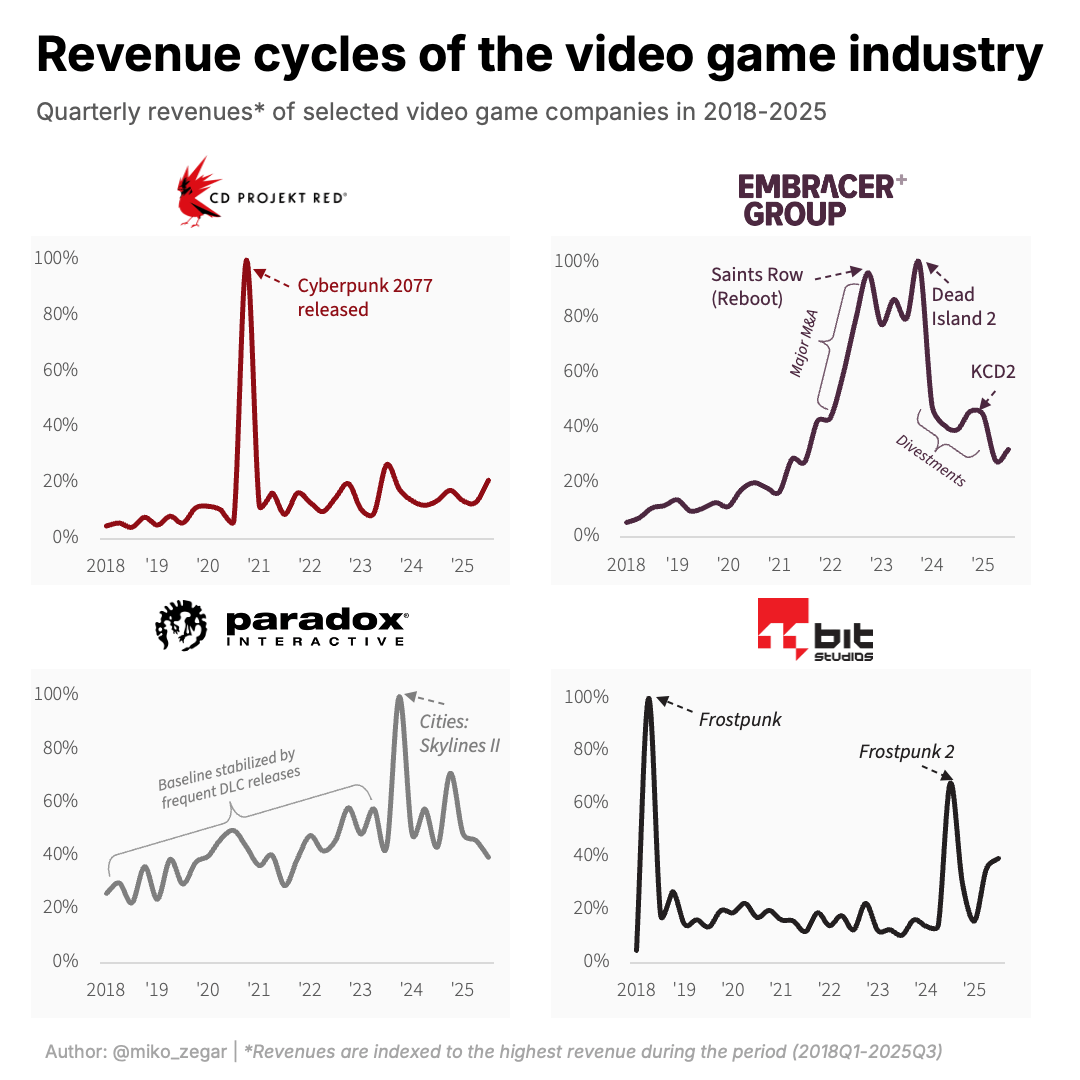
Method: Revenues are indexed to each company's highest quarterly peak (100%) to compare volatility regardless of company size.
Note on Embracer: Adjusted their non-standard fiscal year to match calendar quarters for consistency.
A few insights:
- CD Projekt & 11 Bit Studios: Total "hit-driven" models. See the massive Cyberpunk spike!
- Embracer: A bit of a roller coaster. The trend is messy because of all the buying (M&A) and recent selling (divestments), but you can still spot the Saints Row and Dead Island 2 bumps. Embracer is a bit different from the rest, as it comprises >70 internal dev studios
- Paradox: Their "floor" is way higher because of the frequent DLC releases.
Sidenote: I’m already prepping for the GTA VI launch; that Take-Two spike is going to be massive. Can't wait to chart it!
\* https://www.cdprojekt.com/en/investors/
https://embracer.com/investors/reports-presentations/
https://ir.11bitstudios.com/en/financial-data/
https://www.paradoxinteractive.com/investors/financial-reports
Posted by Affectionate_Sun1797
9 Comments
It’s a bit like pharmaceuticals: many years invested in development hoping for a hit from which you can extract revenues during that patent exclusivity period.
Would be interesting to see Bethesda or Rockstar, since they keep milking the same games with rereleases
Paradox is also a publisher. What data did you use?
Found this https://www.reddit.com/r/CDProjektRed/comments/16xrlld/roadmap_for_upcoming_cdpr_games/
Plot axis are terrible. Who puts a % on a Y axis for data of this nature? Fart sound
Dead island 2 really did twice as much as KCD2? That’s wild
Interrested to see Rockstar and Ubisoft!
I’m completely convinced that if 11-bit had published Ixion it would have sold better than Frostpunk 2.
Embracer’s chart is as terrible as the entire corporation.