
 Pricing Fair After Strong Multi‑Year Share Gains?")
- If you are wondering whether Live Nation Entertainment is priced attractively today, it helps to step back from the headlines and look closely at what the numbers are saying about the stock.
- The shares recently closed at US$146.97, with returns of 1.8% over the past week, 0.8% over the last month, 1.1% year to date, 4.4% over 1 year, 82.9% over 3 years and 121.2% over 5 years. These figures may shape how the market currently views its potential and risks.
- Recent news coverage around Live Nation has focused on the company as a major player in live events and ticketing, alongside ongoing regulatory and industry discussions that can influence how investors think about future growth and business resilience. These themes often feed directly into how the market prices expectations for future cash flows and risk.
- On Simply Wall St’s six point valuation check, Live Nation Entertainment currently scores 0 out of 6. This raises an important question about how different valuation methods frame the stock today and whether there is a smarter way to interpret those signals, which we will come back to at the end of this article.
Live Nation Entertainment scores just 0/6 on our valuation checks. See what other red flags we found in the full valuation breakdown.
Approach 1: Live Nation Entertainment Discounted Cash Flow (DCF) Analysis
A Discounted Cash Flow, or DCF, model estimates what a company could be worth today by projecting its future cash flows and then discounting those back to a single present value figure.
For Live Nation Entertainment, the model used is a 2 Stage Free Cash Flow to Equity approach. The latest twelve month Free Cash Flow is about $1.80b. Analysts provide explicit cash flow projections out to 2029, with Simply Wall St extending the view a further five years using its own assumptions. For example, projected Free Cash Flow in 2029 is $2.14b, with intermediate years such as 2026 to 2028 also modeled and then discounted back to today.
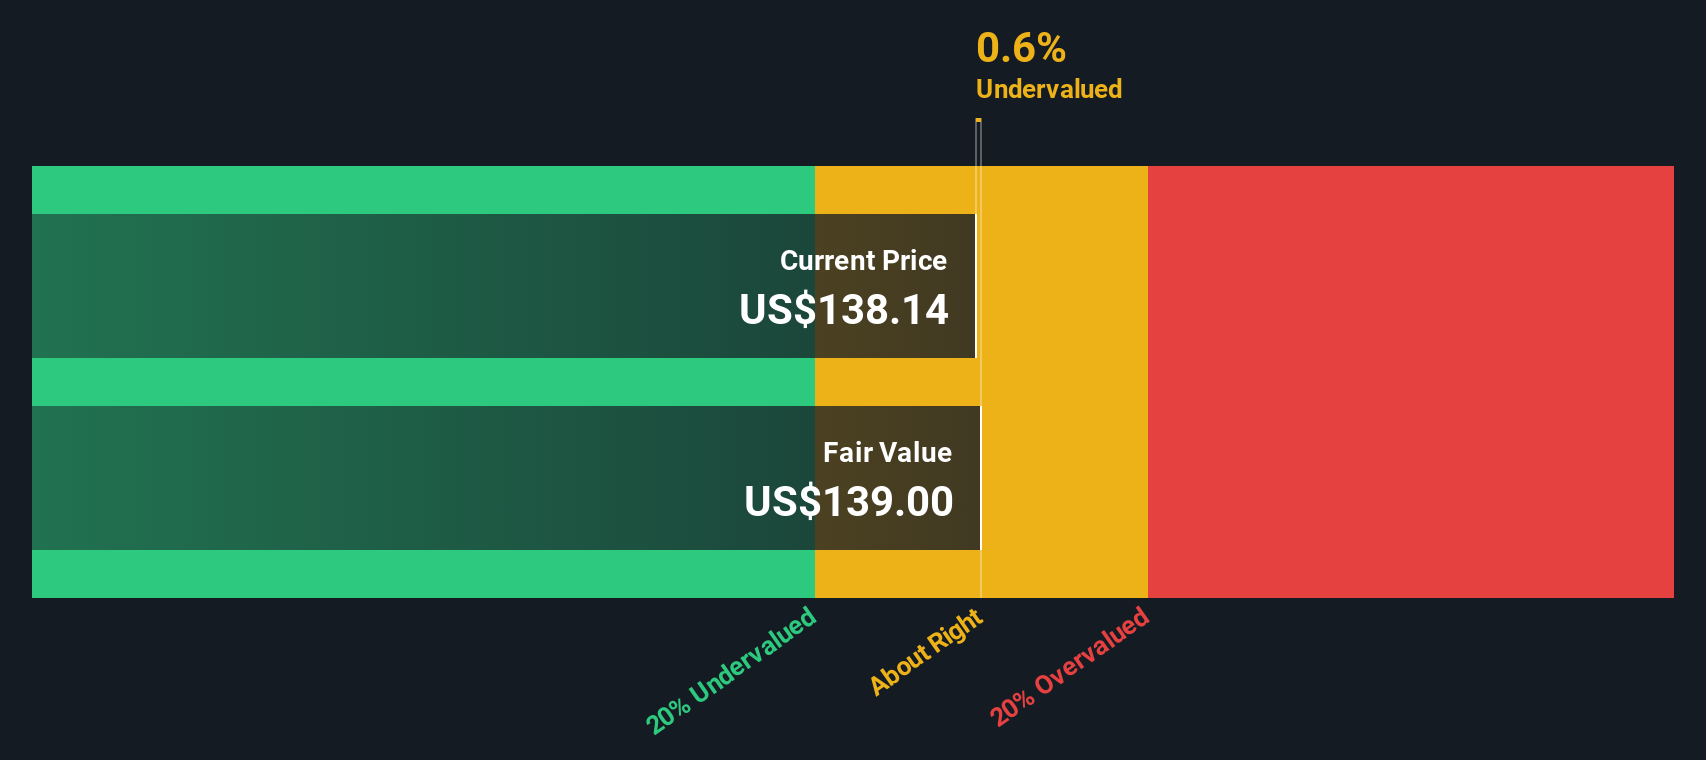
Putting all of those discounted cash flows together, the DCF model arrives at an estimated intrinsic value of about $141.03 per share. Compared with the recent share price of $146.97, this implies the stock is around 4.2% overvalued on this basis.
Result: ABOUT RIGHT
Live Nation Entertainment is fairly valued according to our Discounted Cash Flow (DCF), but this can change at a moment’s notice. Track the value in your watchlist or portfolio and be alerted on when to act.
 LYV Discounted Cash Flow as at Jan 2026
Approach 2: Live Nation Entertainment Price vs Earnings
For a profitable company like Live Nation Entertainment, the P/E ratio is a straightforward way to see how much you are paying for each dollar of earnings. It links directly to the bottom line that ultimately supports shareholder returns.
What counts as a “normal” P/E depends on what the market expects from a company. Higher growth or lower perceived risk can support a higher multiple, while slower growth or higher risk usually calls for a lower one.
Live Nation Entertainment currently trades on a P/E of 105.92x. That sits well above the Entertainment industry average of 21.07x and also above the 57.94x average for its peers. Simply Wall St’s Fair Ratio framework takes this a step further. It estimates what a more tailored P/E might look like, based on factors such as earnings growth, profit margins, industry, market cap and company specific risks, instead of relying only on broad peer or sector comparisons.
On this basis, the Fair Ratio for Live Nation Entertainment is 39.99x, which is well below the current 105.92x. That gap suggests the shares are trading rich relative to what the Fair Ratio would indicate.
Result: OVERVALUED
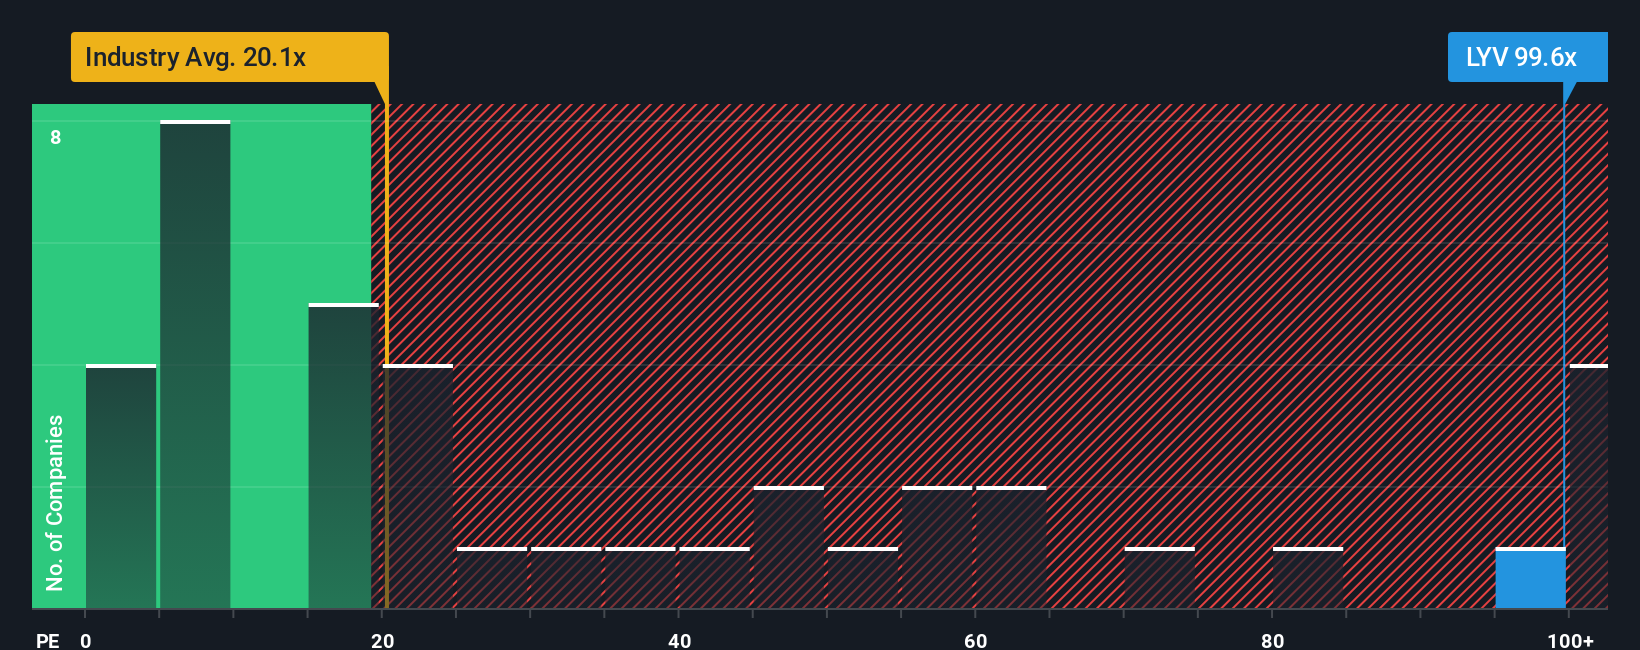 NYSE:LYV P/E Ratio as at Jan 2026
P/E ratios tell one story, but what if the real opportunity lies elsewhere? Discover 1429 companies where insiders are betting big on explosive growth.
Upgrade Your Decision Making: Choose your Live Nation Entertainment Narrative
Earlier we mentioned that there is an even better way to understand valuation, so let us introduce you to Narratives, which are simply your own story about Live Nation Entertainment, backed by your estimates for future revenue, earnings, margins and a fair value that you can compare to today’s price.
A Narrative connects what you believe about the business to a financial forecast, then to a fair value per share, so you are not just looking at ratios like the P/E in isolation.
On Simply Wall St, Narratives sit inside the Community page, where millions of investors use them as an easy tool to see whether their fair value suggests Live Nation Entertainment is worth more or less than the current market price and to adjust that view as new earnings reports or news arrive.
For example, one Live Nation Entertainment Narrative might assume a relatively high fair value based on stronger revenue growth and margins. Another might assume a lower fair value with more modest growth and profitability. This shows how two investors can look at the same stock and reach very different conclusions.
Do you think there’s more to the story for Live Nation Entertainment? Head over to our Community to see what others are saying!
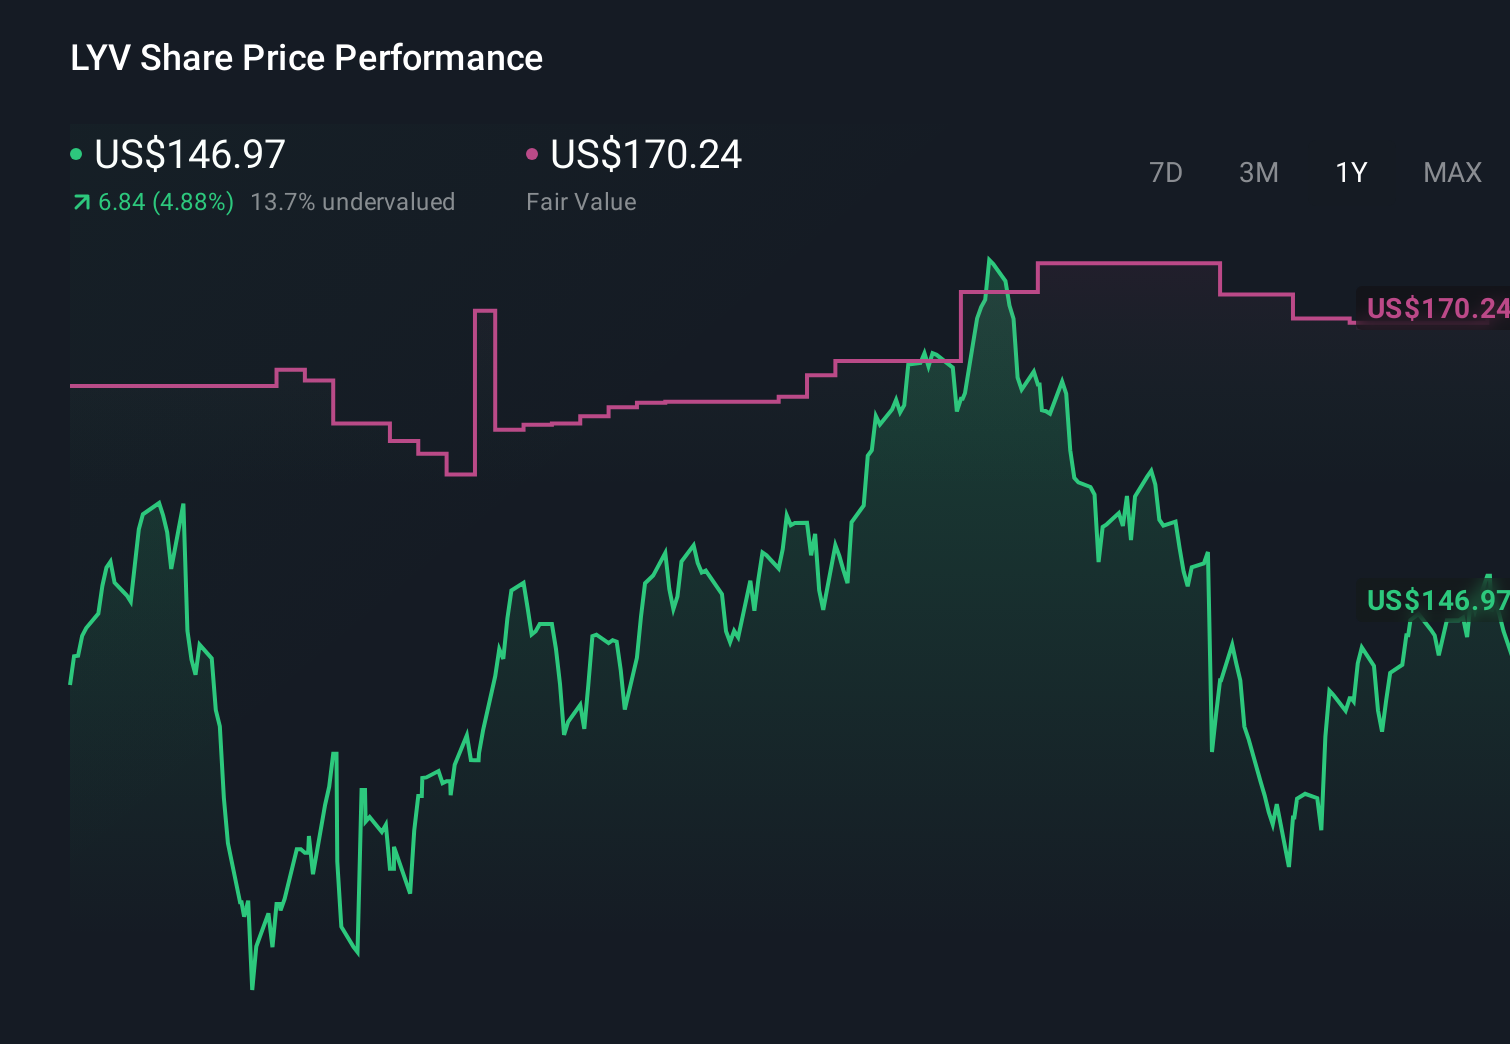 NYSE:LYV 1-Year Stock Price Chart
This article by Simply Wall St is general in nature. We provide commentary based on historical data
and analyst forecasts only using an unbiased methodology and our articles are not intended to be financial advice. It does not constitute a recommendation to buy or sell any stock, and does not take account of your objectives, or your
financial situation. We aim to bring you long-term focused analysis driven by fundamental data.
Note that our analysis may not factor in the latest price-sensitive company announcements or qualitative material.
Simply Wall St has no position in any stocks mentioned.
Our new AI Stock Screener scans the market every day to uncover opportunities.
• Dividend Powerhouses (3%+ Yield)
• Undervalued Small Caps with Insider Buying
• High growth Tech and AI Companies
Or build your own from over 50 metrics.
Have feedback on this article? Concerned about the content? Get in touch with us directly. Alternatively, email editorial-team@simplywallst.com