
![[OC] Visualization of pizza restaurant locations and ratings across Manhattan](https://www.byteseu.com/wp-content/uploads/2026/01/o40ji9kxxweg1-1046x1536.jpg "[OC] Visualization of pizza restaurant locations and ratings across Manhattan")
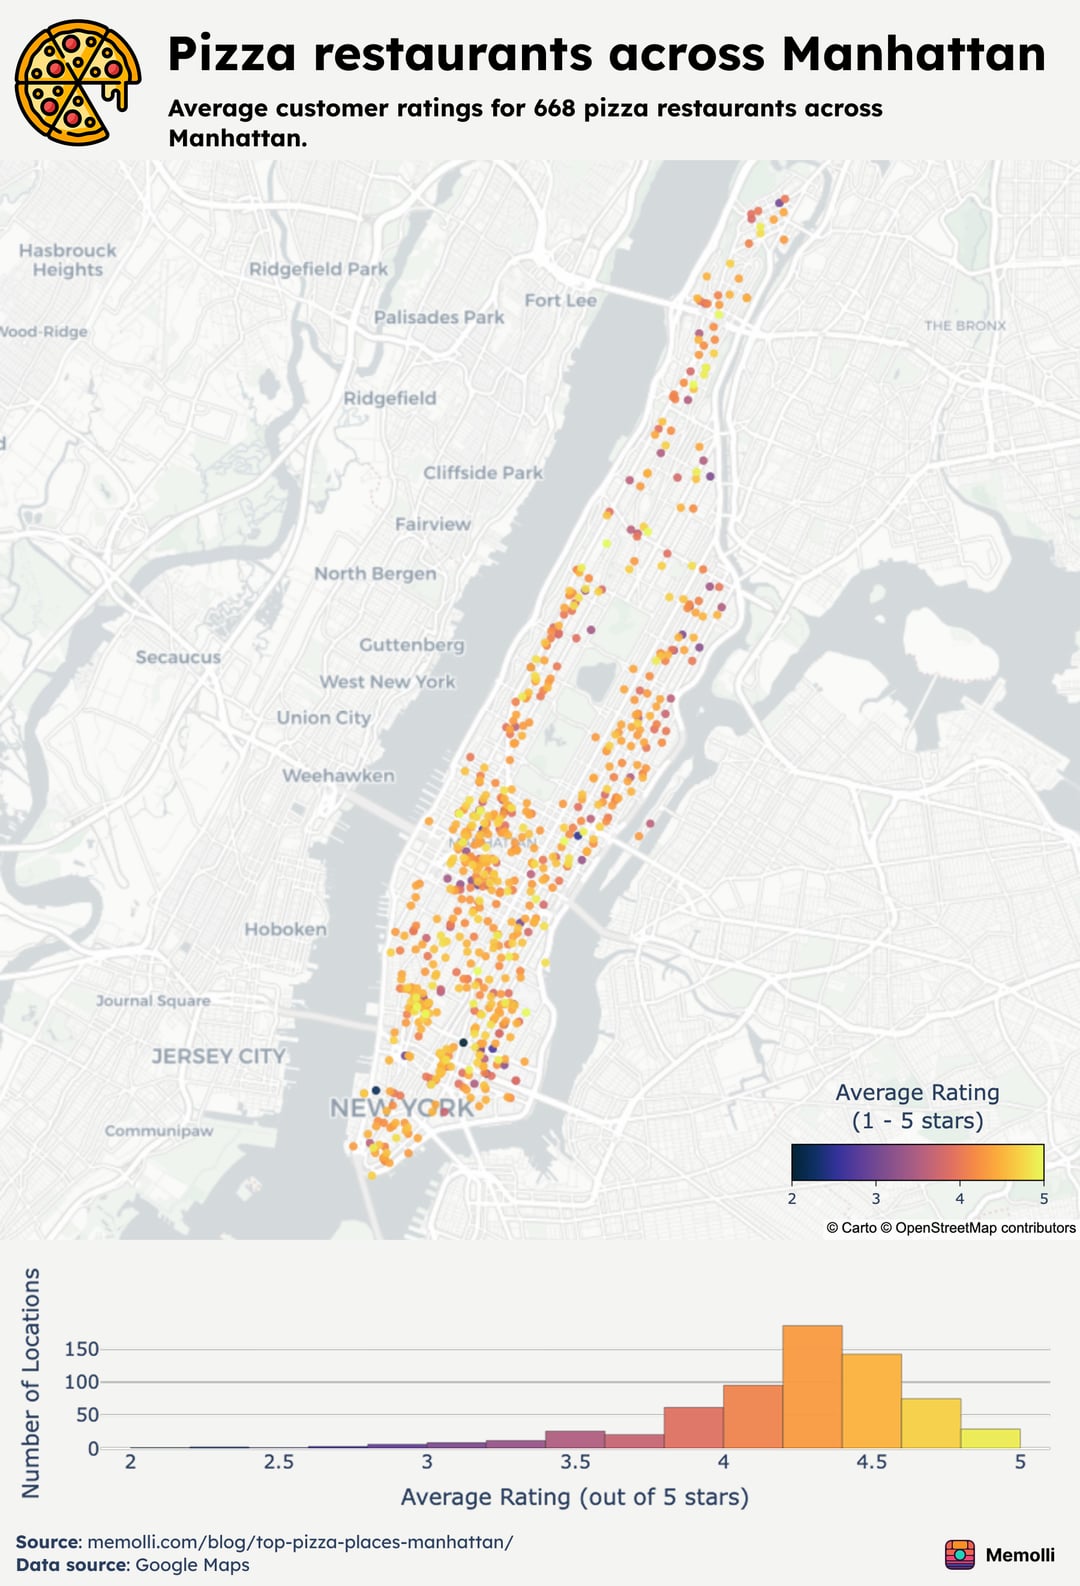
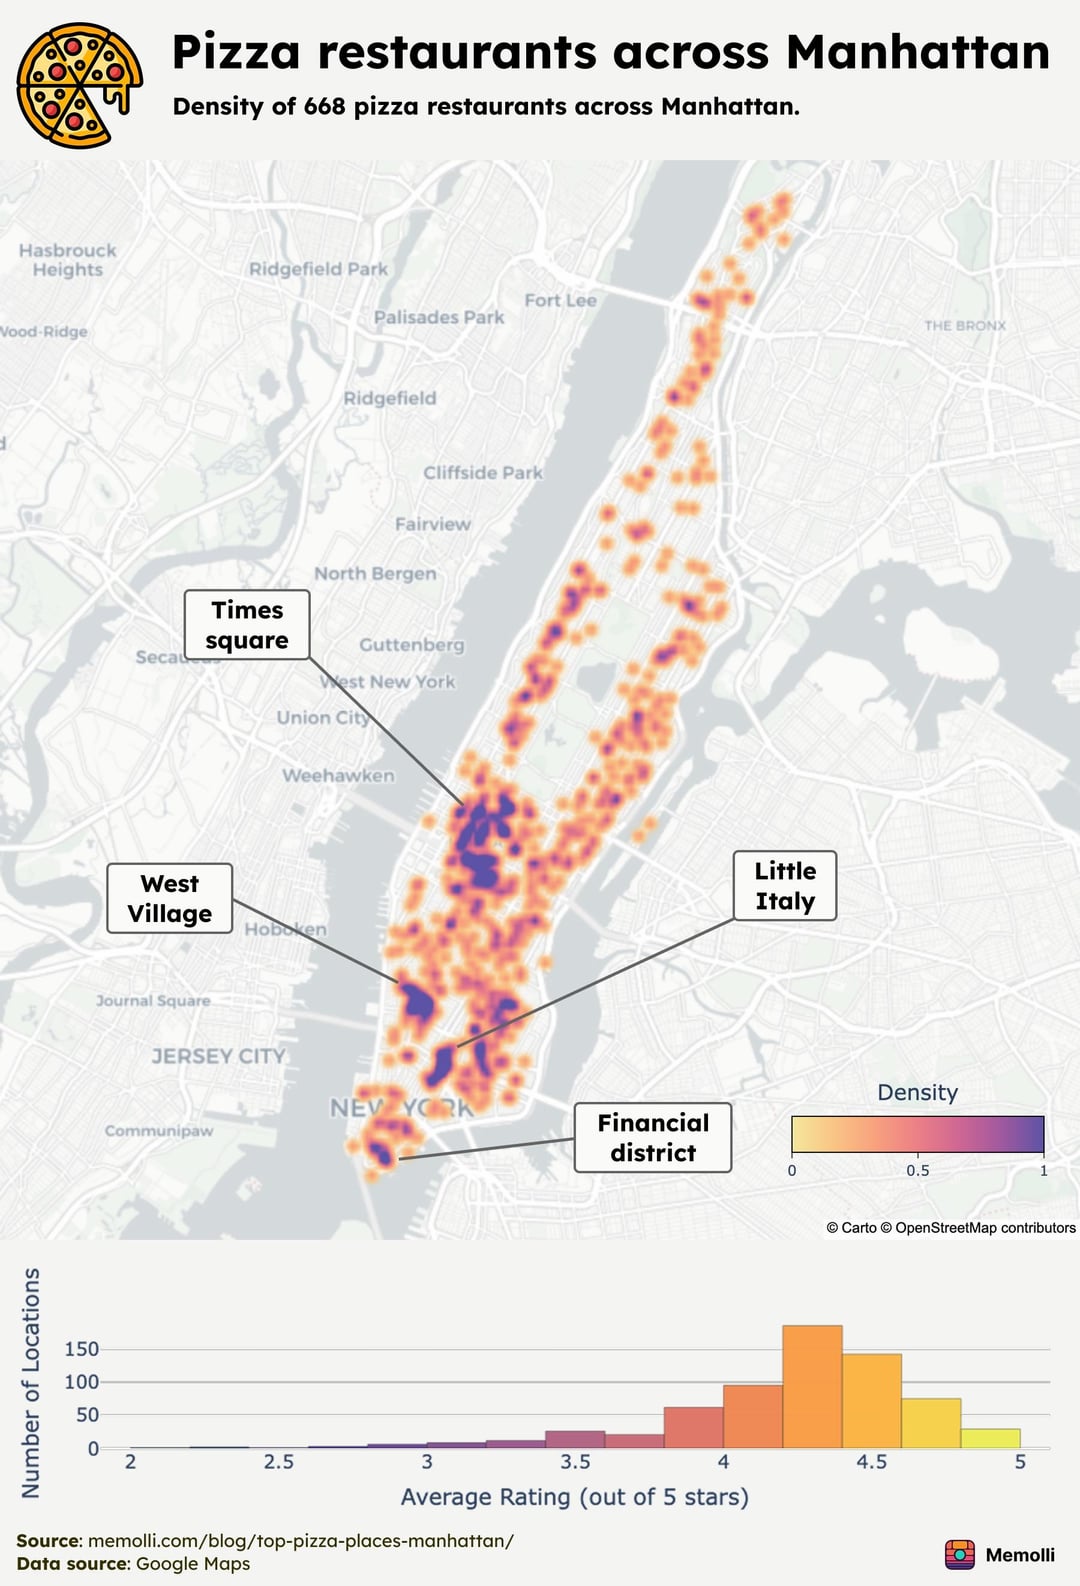
Plots where made using Python, Plotly, and Figma. Data is from Google Maps using their API. More details on the code used used to fetch and visualize the data are here: https://www.memolli.com/blog/top-pizza-places-manhattan/
Posted by Alive-Song3042
2 Comments
What are the units for density? 1 restaurant per square mile? Per city block? Per building? Per pizza restaurant? Per pound?
I think it definitely represents what we all know intuitively. Pizza is like sex. Even when it’s bad, it’s still pretty good.