datasource: fifa.com + https://en.wikipedia.org/wiki/FIFA_World_Cup_records_and_statistics
tools used: datawrapper.de
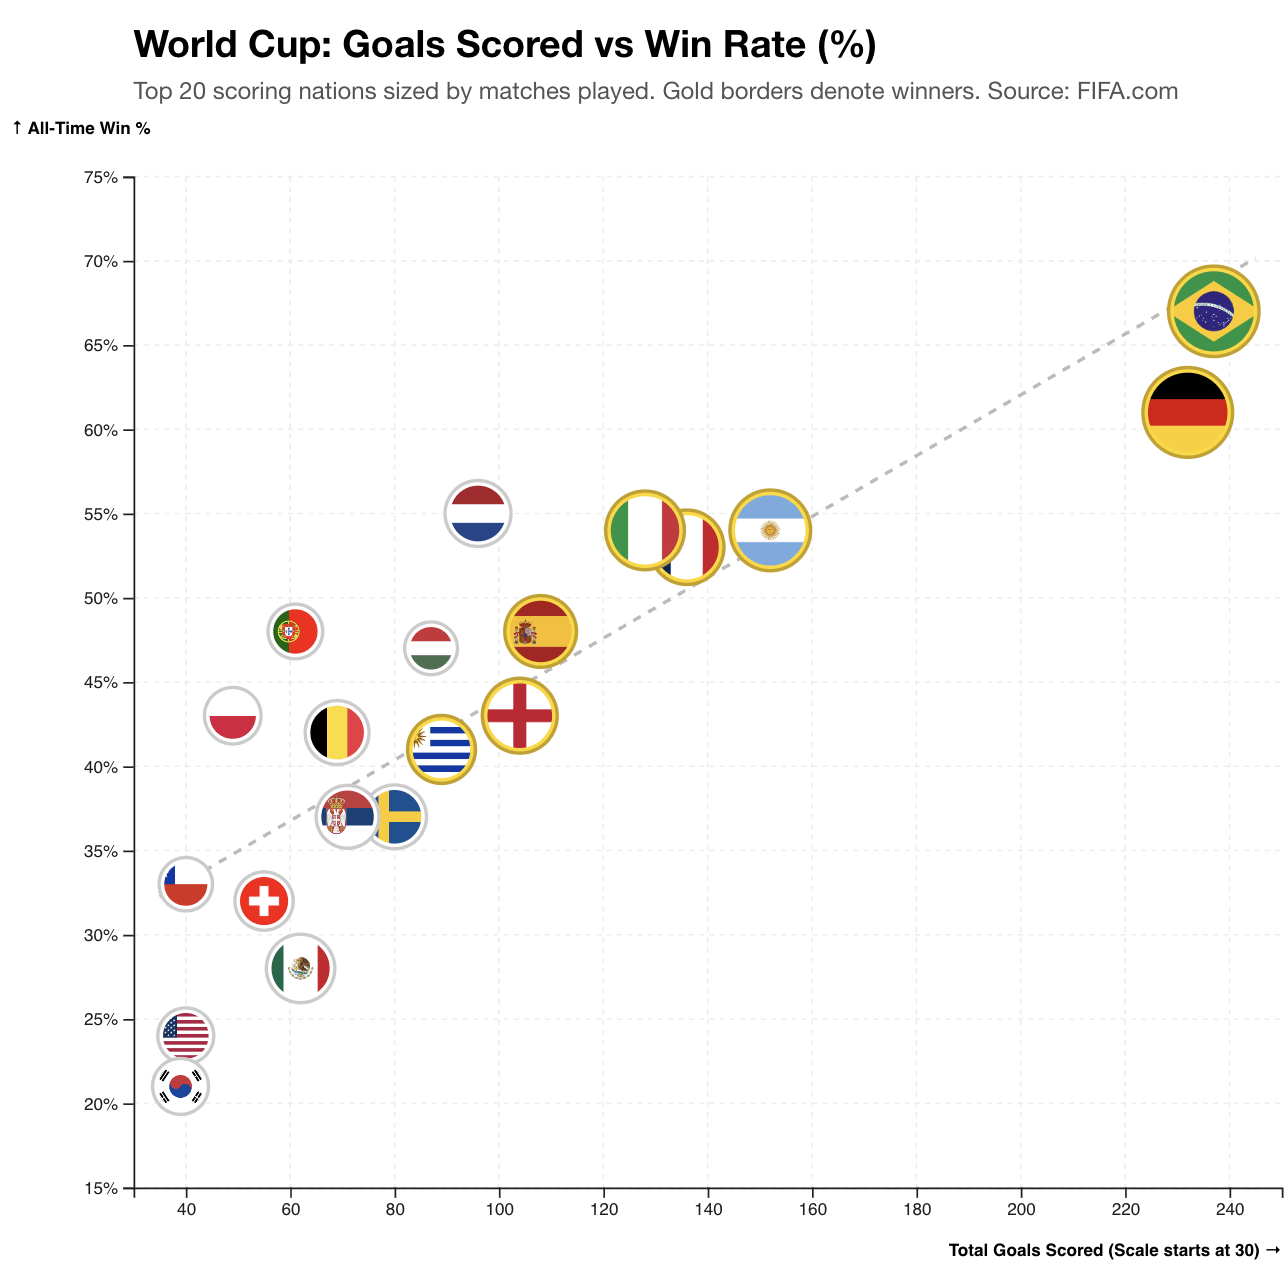
note: axes are truncated to highlight variance between top teams.
Posted by worldcup-stats

![[OC] World Cup - Goals Scored vs Win Rate (All Time)](https://www.byteseu.com/wp-content/uploads/2026/01/majn2yn9epfg1-1024x1013.png "[OC] World Cup – Goals Scored vs Win Rate (All Time)")
datasource: fifa.com + https://en.wikipedia.org/wiki/FIFA_World_Cup_records_and_statistics
tools used: datawrapper.de
note: axes are truncated to highlight variance between top teams.
Posted by worldcup-stats
20 Comments
Finally some cool data that isn’t about people’s failed tinder matches
I’m not a Football/Soccer person but does this infer that France usually has better than average defense?
So we can conclude that the more goals you make, the more you win?
The Netherlands, one of the great to never win the WC.
Not beautiful!
You show a ratio (per game) on the y axis but cumulated goals on the the x axis; cumulated over all World Cup participations!
You are hiding that these nations played a vastly different number of games to shoot all those goals.
If you want to show any meaningful relation, *please* scale the goals by the number of games!
The dashed line in the middle doesn’t make any sense to me.
Also I don’t like that scales start from 15% / 30 goals. You barely save any space with such small offsets, but get all that visual distortion of shifted axes.
how many more world cups do we need to make up for those 100 goals we’re missing to reach Brazil and Germany? They got a huge head start back in the prehistoric days of football…
Looking this my mind went automatically to 7-1
Wow Korea being on that chart is hilarious, wouldn’t be surprised if it gets knocked off it during this tournament.
Actually I’m wondering if USSR, Czechoslovakia, and Yugoslavia goals did not get inherited here.
That 7:1 brought us closer to Brazil
Germany is an outlier there probably due to the number of goals it scores against Brazil. Argentina is also one of “top” scorers since it beat Perú by 6 to nil, in the 78 WC
Now do it for the Unofficial World Cup
wait a minute. are you saying the more you score the more likely you are to win???? no way!!!
I’d prefer goals/match. But this is certainly cool
Can we see this normalised for matches played?
Im curious about the r^2 hahaha
I think it’s more interesting if we put “average goals per match” since total goals definitely correlate with total matches which in turn definitely correlate with winrate (you play more game the more you win)
July 8th 2014 had a statistical significant impact on the upper right corner.
Goals per game rather than total goals would be interesting to see here.
7:1, you know what i’m talking about 😏