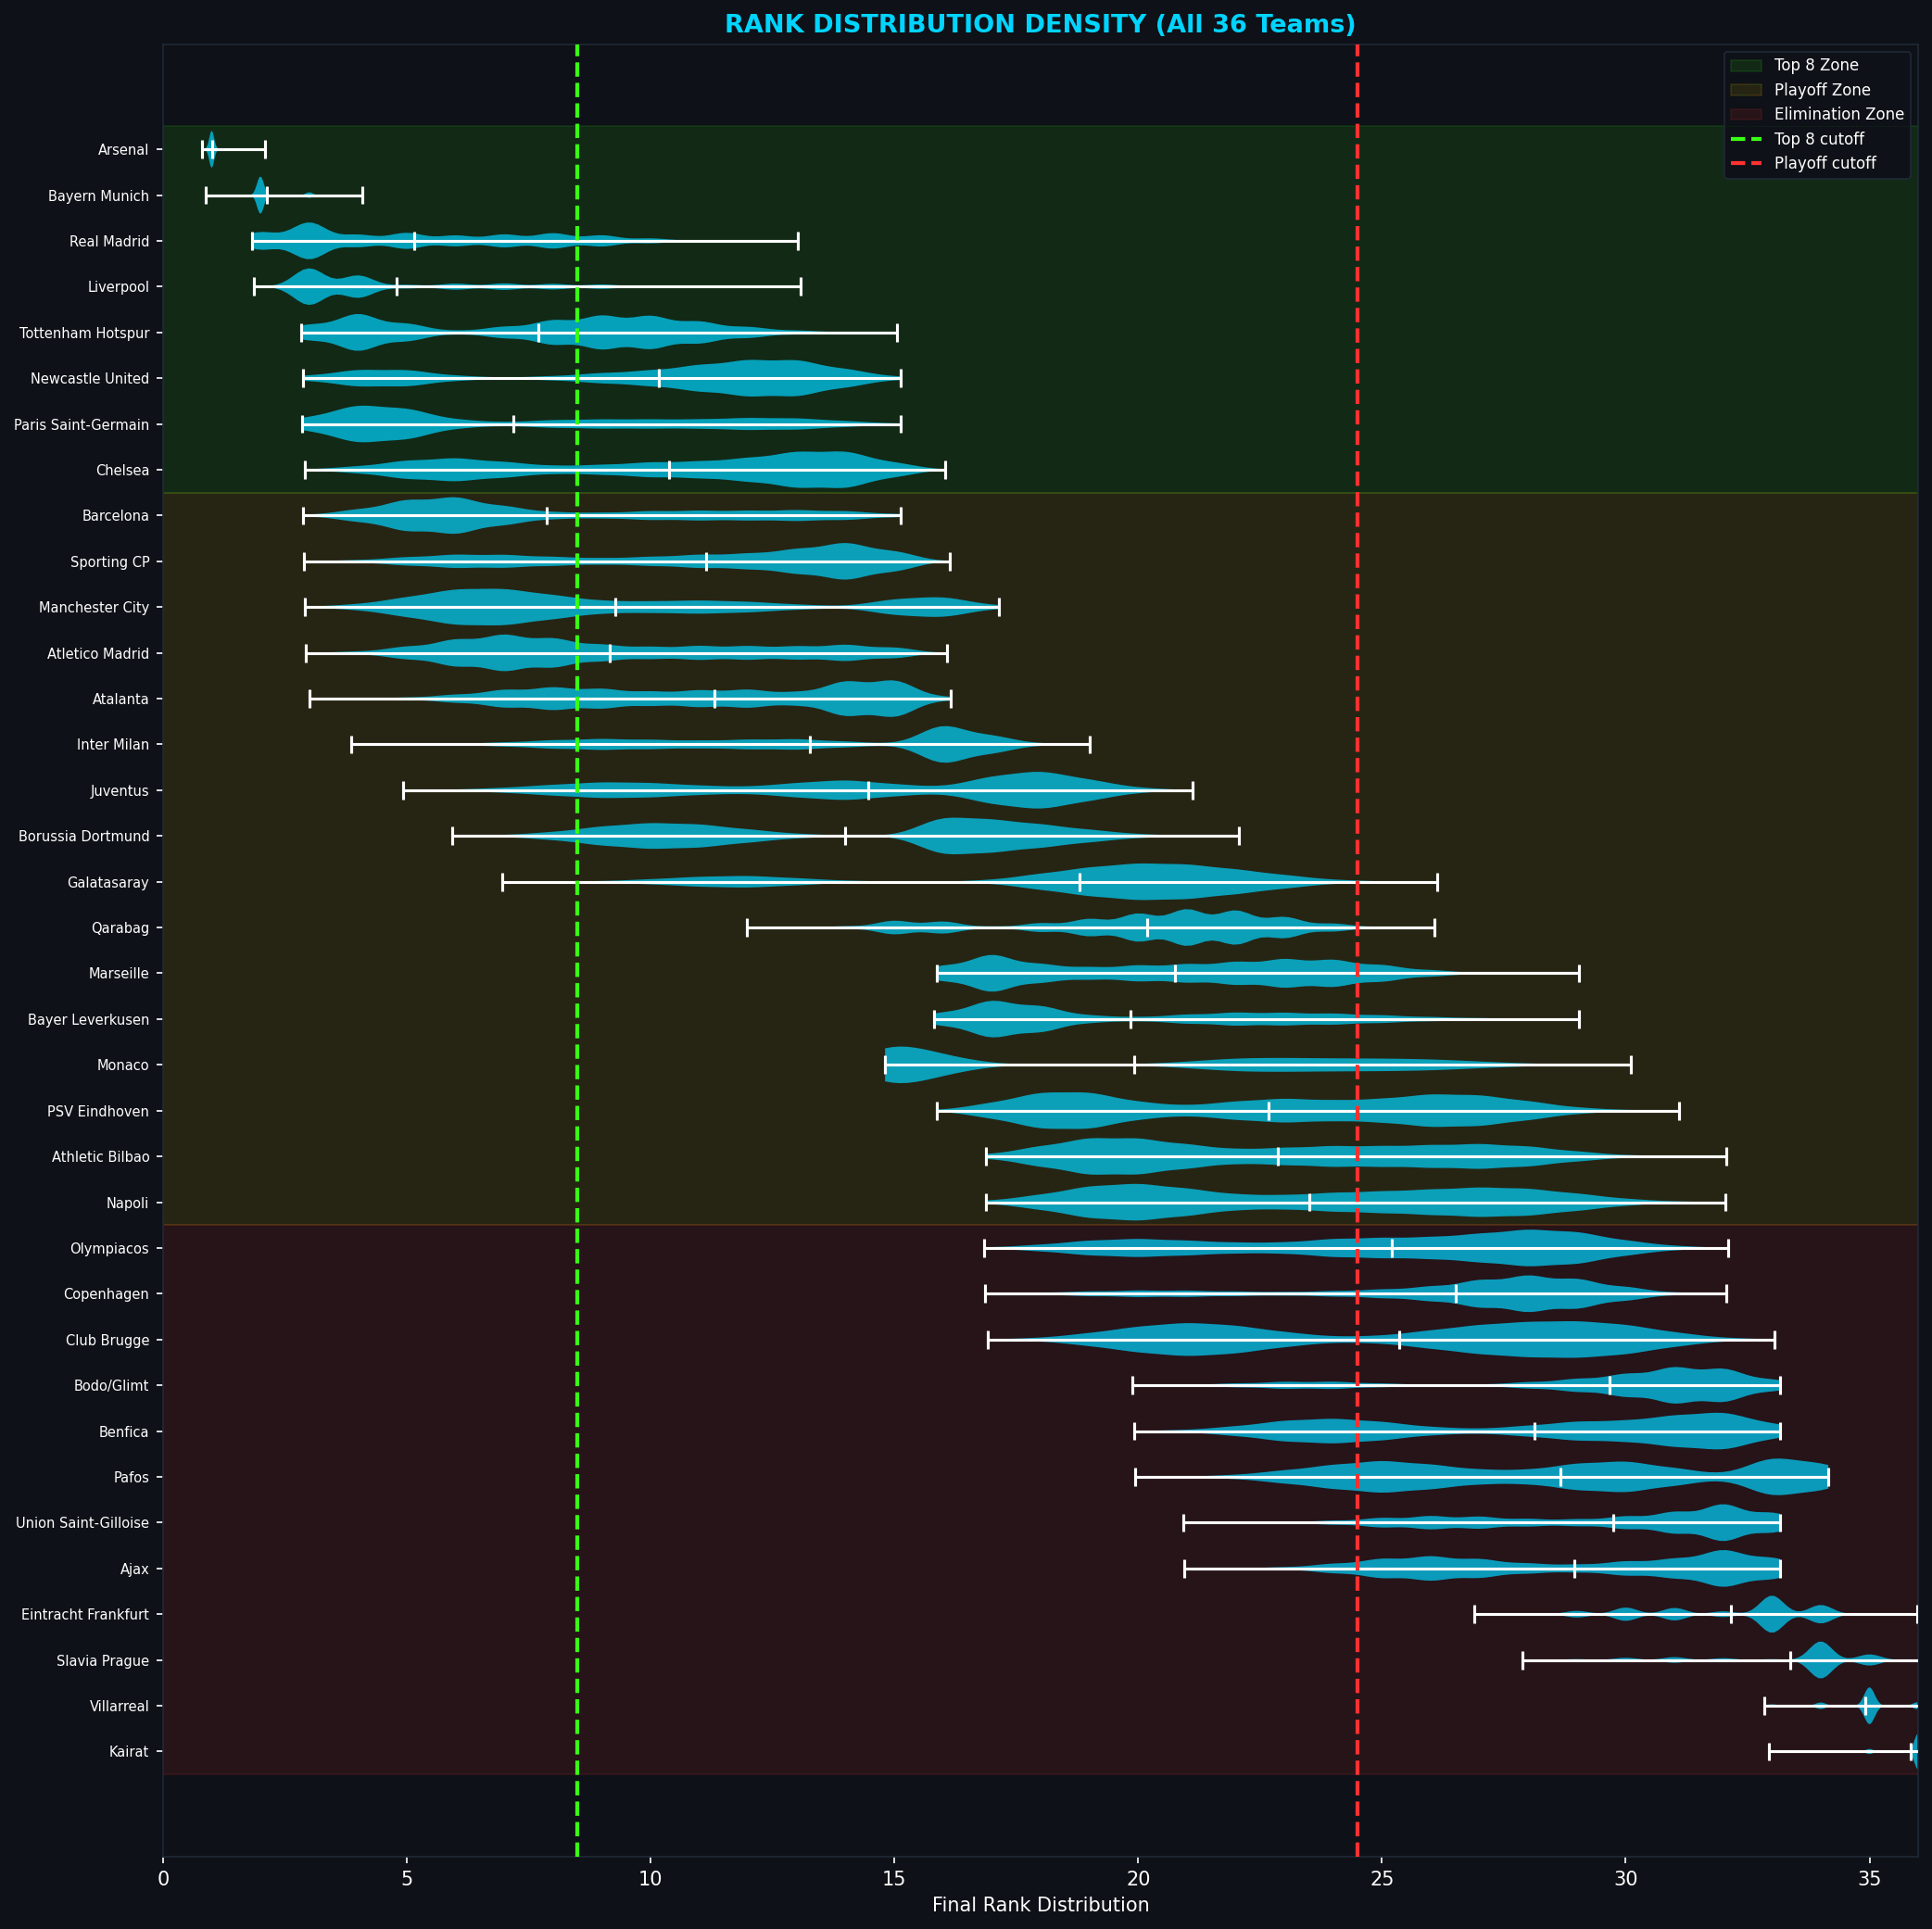
[OC] I simulated Matchday 8 of the Champions League 20,000 times. Here is the probability distribution of the final League Phase standings.
Posted by Business-Cherry1883

![[OC] I simulated Matchday 8 of the Champions League 20,000 times. Here is the probability distribution of the final League Phase standings.](https://www.byteseu.com/wp-content/uploads/2026/01/ku23kgxxjyfg1-1536x1534.png "[OC] I simulated Matchday 8 of the Champions League 20,000 times. Here is the probability distribution of the final League Phase standings.")
[OC] I simulated Matchday 8 of the Champions League 20,000 times. Here is the probability distribution of the final League Phase standings.
Posted by Business-Cherry1883
11 Comments
[deleted]
Such a good visualisation
Excellent work! The bulges are amazing
Great stuff! Might be worth a cross-post to r/soccer before Matchday 8 tomorrow
**The Visualisation** This is a “Violin Plot” showing the density of finishing positions for the 36 UCL teams.
* **The “Bulge”:** The wider the shape at a specific rank, the higher the probability the team finishes there.
* **The Line:** The white internal bars show the interquartile range (where the middle 50% of outcomes fall).
**Data Source**
* **Fixtures & Standings:** Official UEFA Matchday 8 Schedule.
* **Team Strength:** [ClubElo.com](http://ClubElo.com) ratings (used to weight the Poisson simulation).
**Key Takeaways**
1. **The Certainty:** Look at **Arsenal** and **Bayern Munich** at the top. Their shapes are thin and compressed. The model is nearly 100% certain of their finishing position (Rank 1 or 2).
2. **The Chaos:** Look at **PSG (Paris Saint-Germain)**. They have a massive “bimodal” distribution (two distinct bulges). This means they will likely either qualify comfortably in the Top 8 OR drop significantly; there is very little middle ground for them.
3. **The Bubble:** The fight for Rank 24 (the elimination cutoff) creates a massive spread of probability for the **12 teams straddling the line**, where a single goal can swing a team 5+ positions.
**Methodology**
* **Engine:** Python (NumPy/Pandas) running 20,000 Monte Carlo simulations.
* **Scoring:** Strength-weighted Poisson distribution based on current team Elo ratings for remaining fixtures.
* **Tiebreakers:** Full UEFA Article 18 implementation (H2H, Goal Difference, Goals Scored, Away Goals, Wins, Away Wins).
**Tools Used**
* Python (Matplotlib)
* Visuals rendered in a custom “Midnight Analytics” theme.
* [**Source Code / GitHub**](https://github.com/ACl365/ucl-permutations)
As a Copenhagen fan, I don’t like this. We did it to ourselves, but I don’t like this
uau! this is not only beautiful but gorgeous data!
do you have any explanation for the multi modality observed on the different teams?
Nice.
Looks like LFC will be in the Top 8.
So Arsenal has less that one in a billion chances to finish under top 8?
Looks like you graphed California
My spidey senses are telling me that Okanball will beat ManCity tomorrow! add that to the graph!