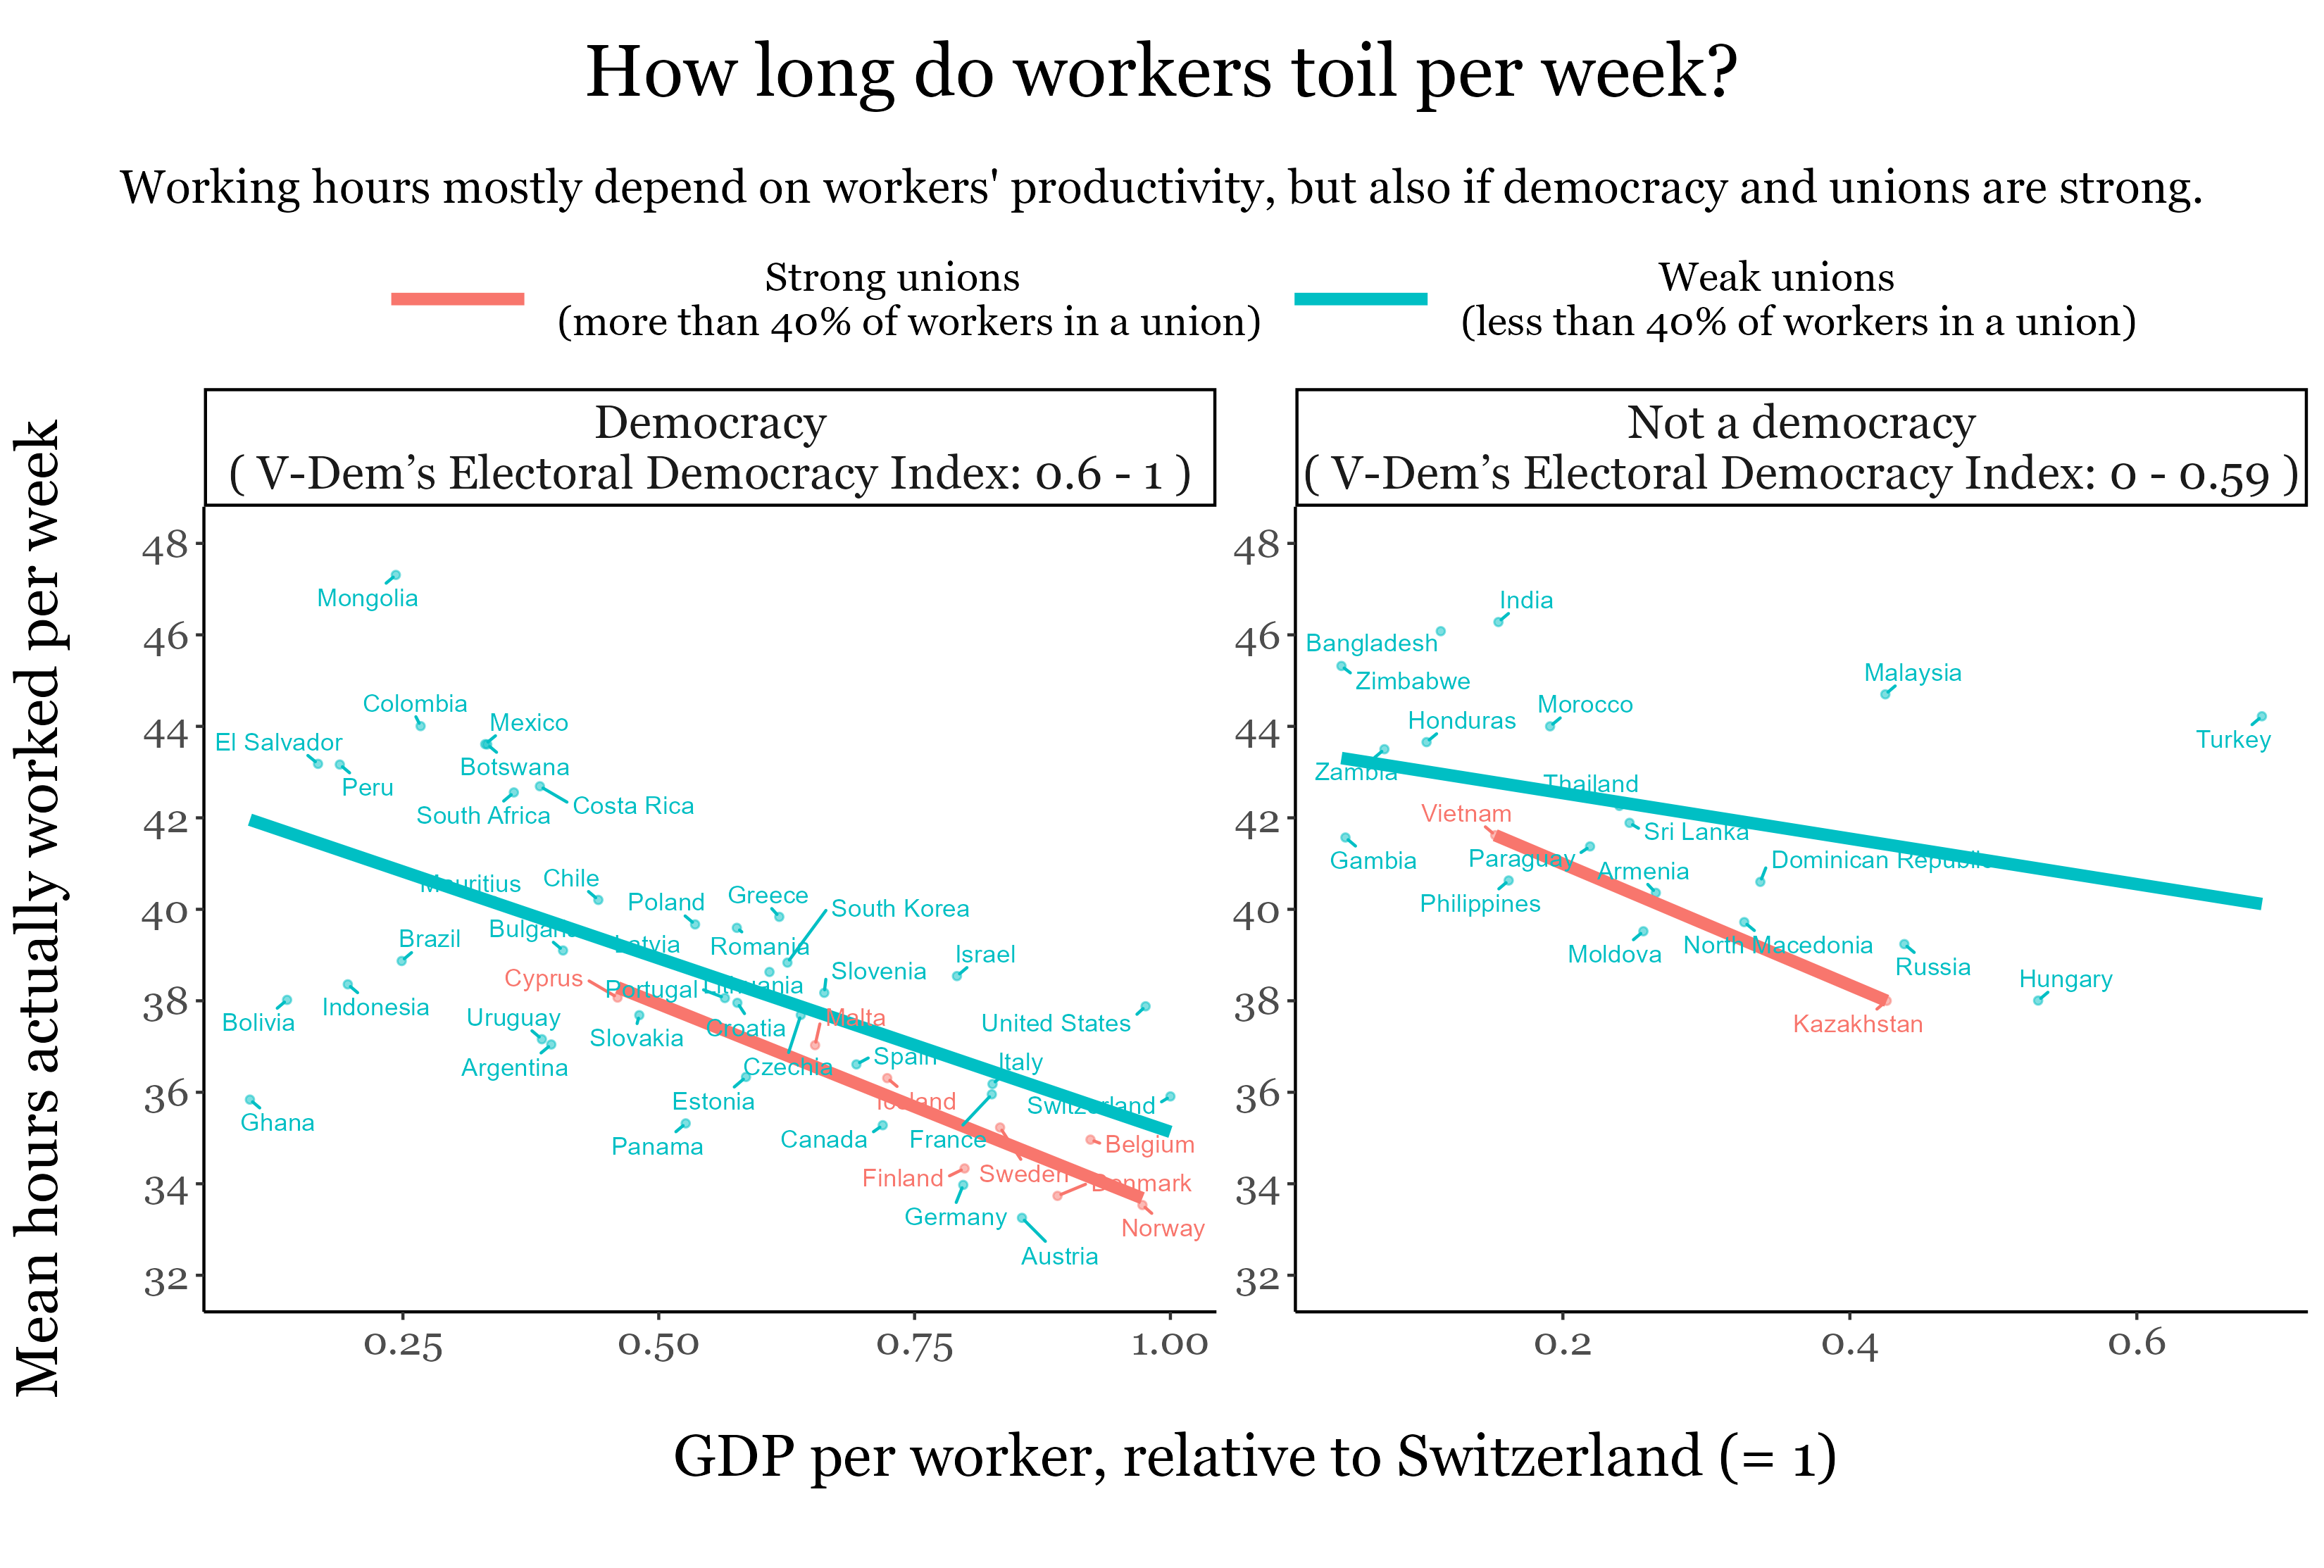
It looks like the distinction between democracy and “not a democracy” is not neccesary. Except for Turkey and (maybe) Malaysia, all oher points would be decently grouped with the distribution of democracies. The difference in trend is probably explained by the lower amount of data and the difference in range of the axes.

![How long do workers toil per week? [OC]](https://www.byteseu.com/wp-content/uploads/2024/06/mw667akp5j5d1-1536x1037.png "How long do workers toil per week? [OC]")
3 Comments
Made with Rstudio.
Source for mean hours actually worked per week: [https://rshiny.ilo.org/dataexplorer57/?lang=en&id=HOW_XEES_SEX_ECO_EST_NB_Q](https://rshiny.ilo.org/dataexplorer57/?lang=en&id=HOW_XEES_SEX_ECO_EST_NB_Q)
Source for the Electoral Democracy Index: [https://ourworldindata.org/vdem-electoral-democracy-data](https://ourworldindata.org/vdem-electoral-democracy-data)
Source for GDP per worker: [https://en.wikipedia.org/wiki/List_of_countries_by_GDP_(PPP)_per_person_employed](https://en.wikipedia.org/wiki/List_of_countries_by_GDP_(PPP)_per_person_employed)
Those R² values sure aren’t beautiful
It looks like the distinction between democracy and “not a democracy” is not neccesary. Except for Turkey and (maybe) Malaysia, all oher points would be decently grouped with the distribution of democracies. The difference in trend is probably explained by the lower amount of data and the difference in range of the axes.