

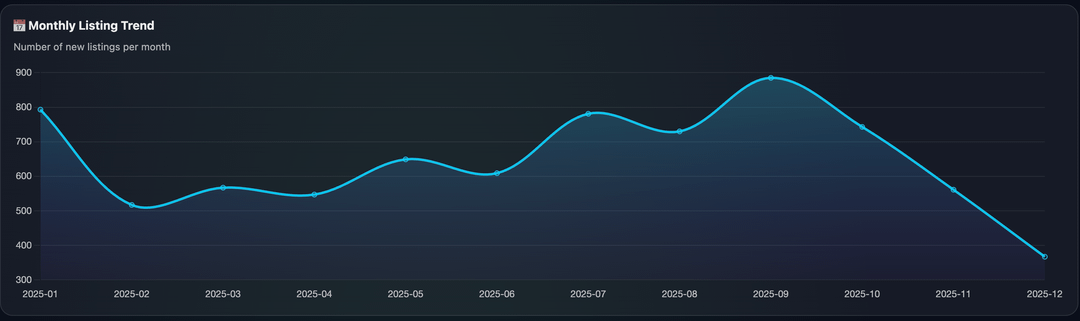
- Q3 2025: 2,396 listings (30.9% of annual volume), September: 885 listings, July: 782 listings, August: 729 listings.
- Ethereum: 2,424 listings (31.3%), BSC: 1,811 listings (23.4%), Solana: 1,542 listings (19.9%).
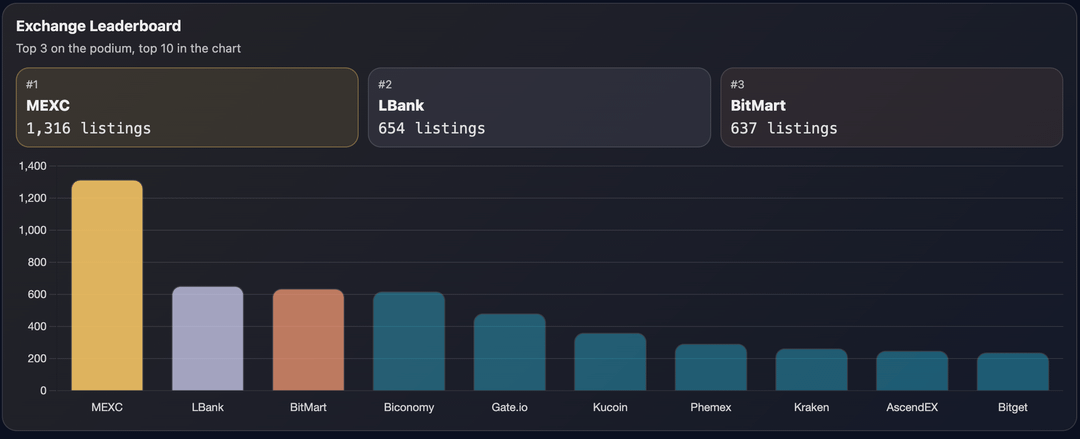
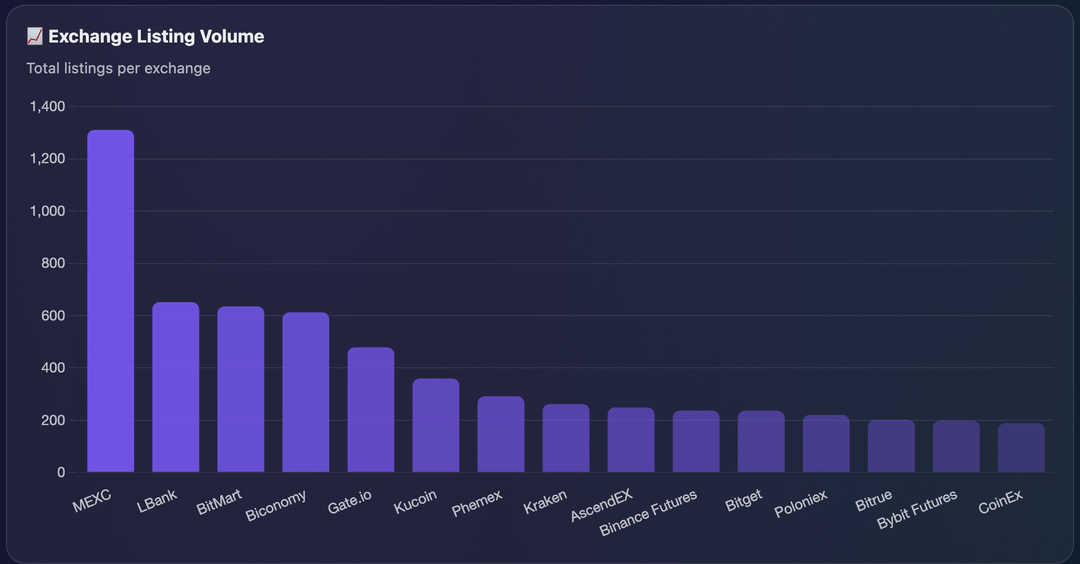
- MEXC: 1,316 listings (16.98%), LBank: 654 listings (8.44%), BitMart: 637 listings (8.22%), Biconomy: 620 listings (8.00%).
- Ethereum tokens: 9.69 average CEX listings per token, Base: 9.25, Sui: 9.52, Solana: 6.83, BSC: 6.43.
- Twitter presence: 7,394 tokens (95.4%), Website: 7,219 tokens (93.2%), Telegram: 4,926 tokens (63.6%), Discord: 3,305 tokens (42.7%).
- Complete infrastructure suite (all 5 assets): 2,147 tokens (27.7%), Any community asset: 6,255 tokens (80.7%).
- Peak day: March 3, 2025 with 86 listings, Peak month: September with 885 listings.
- Top 5 exchanges: 47.86% combined market share, Top 10 exchanges: 78.62% combined market share, Top 15 exchanges: 91.24% combined market share.
- Monthly average: 646 listings, Daily average: 21 listings, Quarterly average: 1,937 listings.
This is based on the research report from https://cryip.co/crypto-exchange-token-listings-report-2025/
The data is also available for download as CSV from Github. Data is compiled from publicly available sources and may be updated or corrected over time.
https://www.reddit.com/gallery/1qq4u5m
1 Comment
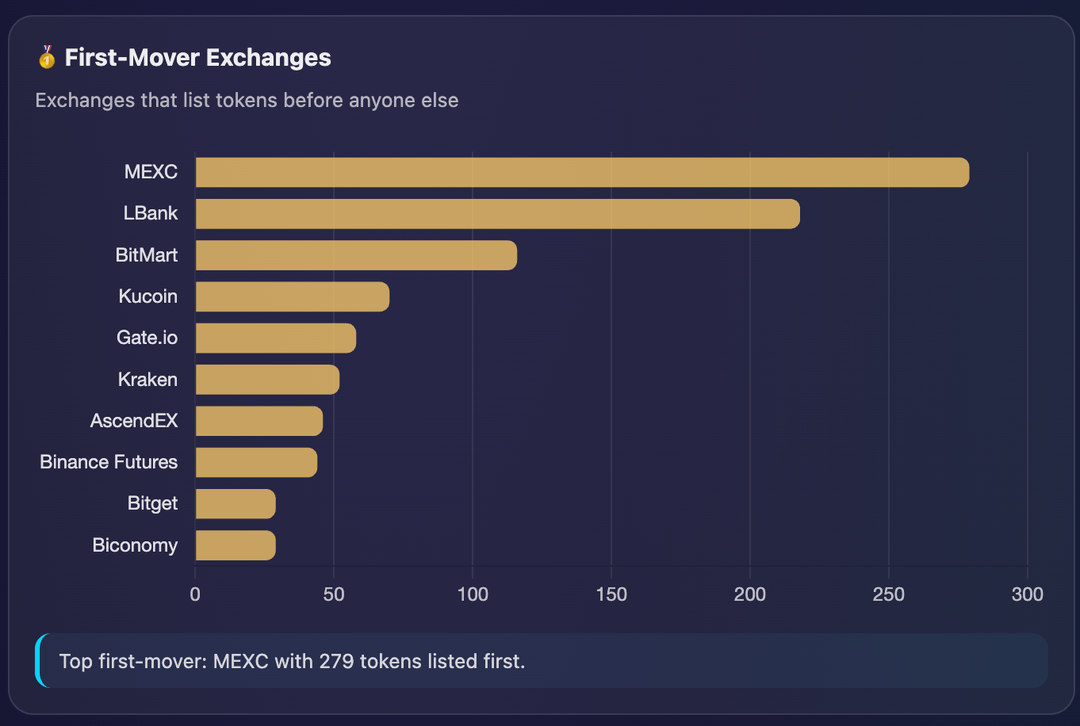
That means if you look for the next diamond you’ll go to MEXC