
![[OC] Champions League - Performance vs Annual Salary](https://www.byteseu.com/wp-content/uploads/2026/01/m4oiyy1ltcgg1-1536x1212.jpeg "[OC] Champions League – Performance vs Annual Salary")
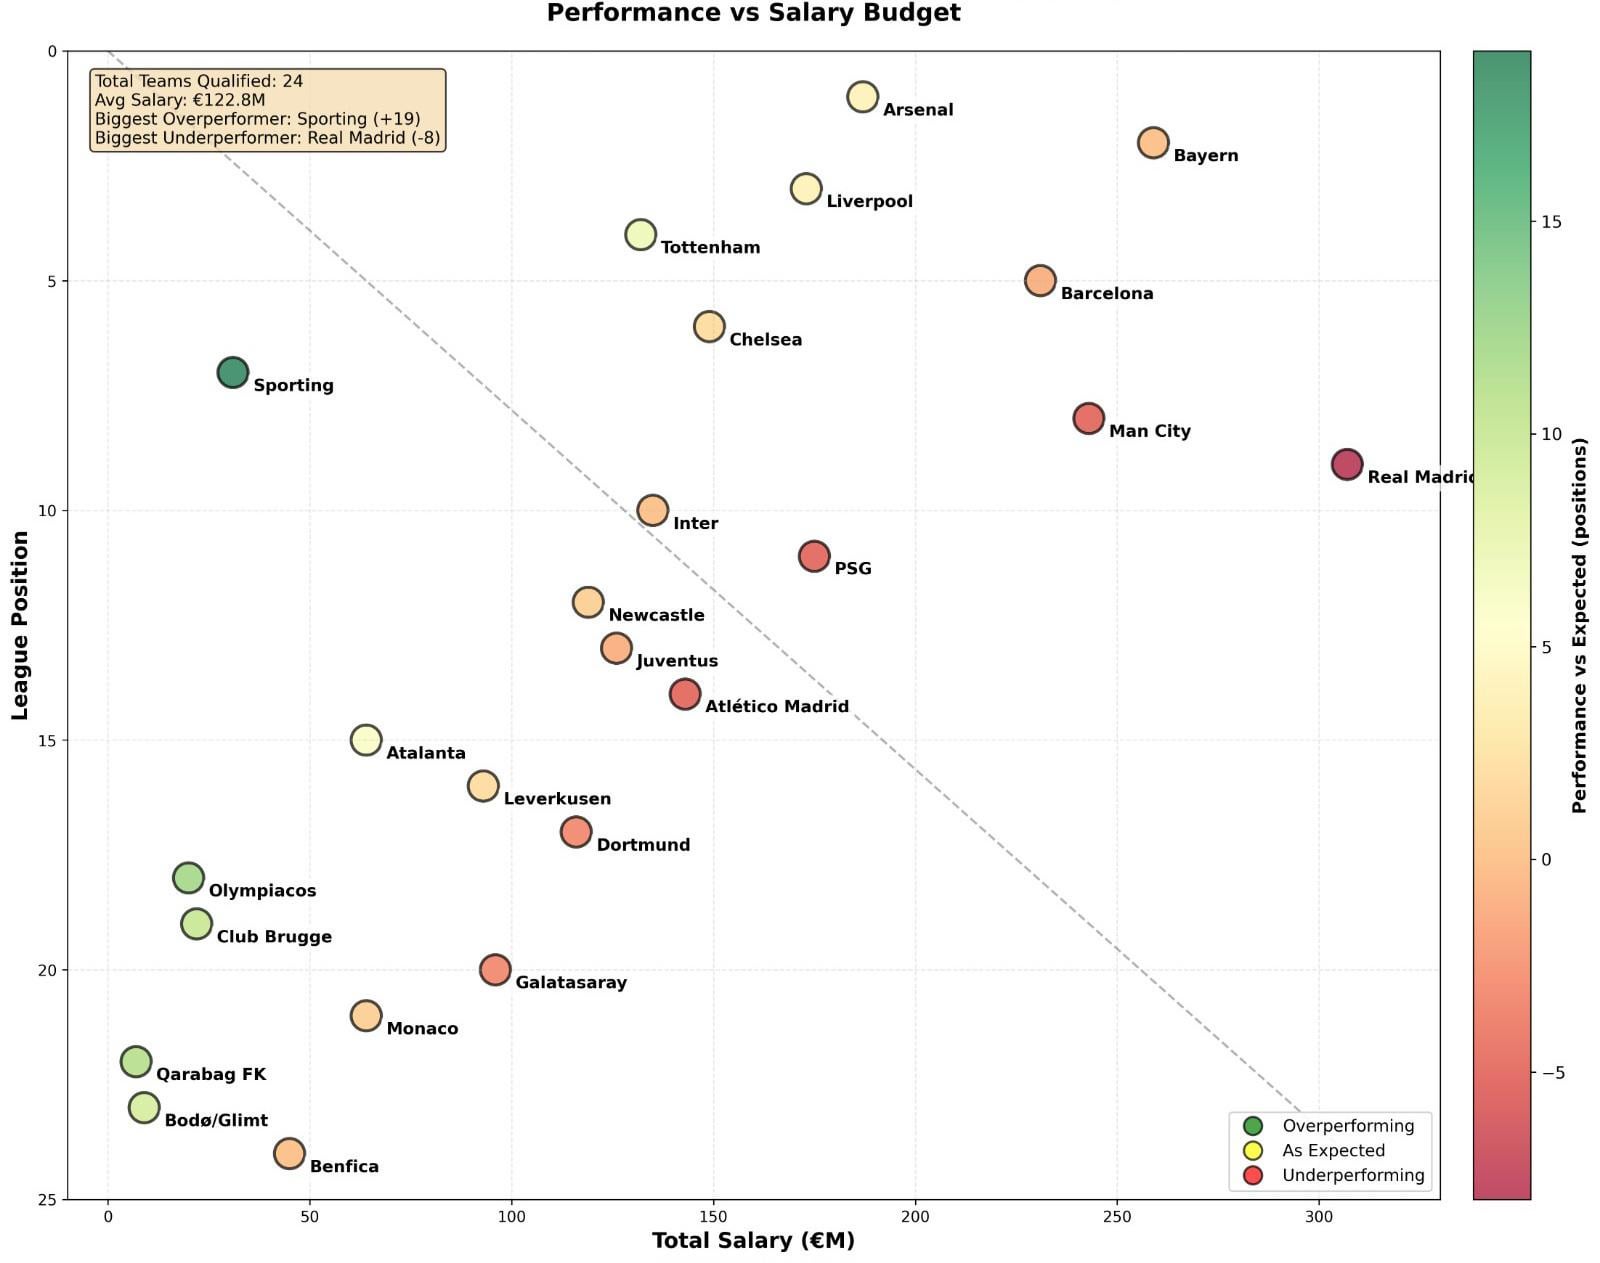
Based on the available data, mostly found through capology + transfermarkt.
Sporting is the top performer based on their annual pay to their squad.
Other overperforming teams;
Olympiacos
Club Brugge
Qarabag FK
Bodo/Glimt
Under performing;
Real Madrid
Man City
PSG
AT Madrid
Posted by molym
20 Comments
what’s up with the dotted line
This should be done against points instead of league positions. For the wages part, please use Deloitte Football report released couple of weeks back. Capalogy wage data is off by as atleast 50-100% for every club.
Data is a little messed up bc some big teams rest their best players more in the early stages. Graphic would be more honest to use starting XI wage bill total for all league phase games as the “salary” axis.
Who has the Y axis start at 25 and end at 0
I don’t get how a team that came in second with the second highest total salary is even slightly under performing. I feel like that is almost the definition of as expected. Unless your key of yellow for as expected is wrong and the orange that Bayern show is the color of 0.
Almost like total salary correlates with league position which correlates with expected performance against other teams. Who would have guessed?
This is a horrible graph, and not even talking about the fact that the wage figures are bs.
I would have liked to see a regression line through these points.
Eyeballing it I reckon the regression line goes between Newcastle and Juventus, with Chelsea, Liverpool and Arsenal all overperforming by ~ £30 Million a year
There should be a better quality filter on this sub. This graph is terrible
Poor submission. Data is ugly. Reported. This feels like a troll post. The dotted line goes the opposite way to correlation.
Did you see that ludicrous display last night?
I see that people in the comments are throwing bad words in your graph.
Yes, I can see that there are quite some data visualization mistakes/improvements there, but I need to congratulate you on your post! It is quite interesting and sparked quite some discussions 🙂 There is room for improvement for sure, I like the idea.
If people just throw bad words at it, why don’t they do it and post it here? Because you actually worked (if it is your graph) by researching, creating and posting it here.
Very interesting graph, thank you 🙂
Potential improvements: equal scale + max value scale label to both minimum and maximum at the gradient legend. Label the dotted line in order to know what it means. League position should have minimum value to 1 and not 0. Real Madrid text should be wrapped if it does overflow in the gradient.
This is basically showing that money rules football – except for 1 or 2 outliers.
Not a bad idea, but poor execution:
– colours are wrong, eg Arsenal coming up first and with the 5th wage bill should appear as outperforming
– A simple position versus wage bill differential might be a good primary indicator
– else, points versus wage bill as a graph
NB the real levels of achievement are :
1. Coming up in the top 8, si quakifyes for the last 16
2. Qualifying to playoffs
3. Not Qualifying at all
Using as sample all C1 clubs would have helped
Dotted line should be the other way. You graph the “expected” outcome, which would be highest salary team in first position, and then determine variance from that line. Anyone below that line would be an “underperformer”, anyone over that line would be an “overperformer”. To have the line inverted, you can’t not tell easily by looking at the graph what you are solving for
Guess I’m a sporting fan now!
Should the trend line be left bottom to right top? It seems to align with the data better and it does seem that it is reasonable to assume higher wage leads to better position…..
Wow that range of salaries in mind boggling! Must make it hard to have competitive fixtures
Spurs surprised me the most.
Their PL form to CL position is crazy.
I dont know why Bayern is underperforming while being second?