I’d love to know the brand breakdown. There’s a lot of shitty e-bikes out there.
dsp_guy on
People riding these bikes as an alternative to owning a car – I think that’s great.
People riding these bikes and pretending they are exercising – they are a joke.
un-copain on
might be interesting to see percentages of fire accident in each of these disciplines instead of raw numbers.
hache-moncour on
I’m more concerned about what’s happening with the busses. I assume there are a couple hundred thousand ebikes in London, and only a couple thousand busses. And while there are plenty of cheapo dodgy e-bikes out there, I would expect busses to be somewhat higher grade and better maintained, and not 9 times more likely to catch fire than bikes, by ratio.
Buttlather on
They don’t have scooters in London?
sithelephant on
Kinda missing the graph comparing this with conventional car fires on a per-car basis. (And indeed other fire sources)
qghw47QHwG72 on
I love e-bikes, but we really gotta crack down on the dodgy imported conversion kits/batteries of dubious quality!
And install way more outside bike storage so they’re not catching fire in
Consistent-Annual268 on
This needs to be per vehicle to be if any use. The raw number doesn’t tell us the rate of problems these transport modes are having.
iwasnotarobot on
Still less bad than burning petrol
Harmonicano on
For me it is unclear what the data includes. In the source link from the other comment it states EV/ Li-Ion fires. But not every EV fire is a battery fire and gas cars also have li-Ion batteries that burn. So for me the included vehicles are unclear. Anyone got a methodology description? Judging by the amount of busses in London (which is 9000 and 2000EV according to other comments) 20 seems high. But it’s also 0 before 2019 so…
Rammstonna on
Could you make it so it’s relative to the numbers of bike/cars etc
Also a chart with 5 lines is not exactly beautiful data

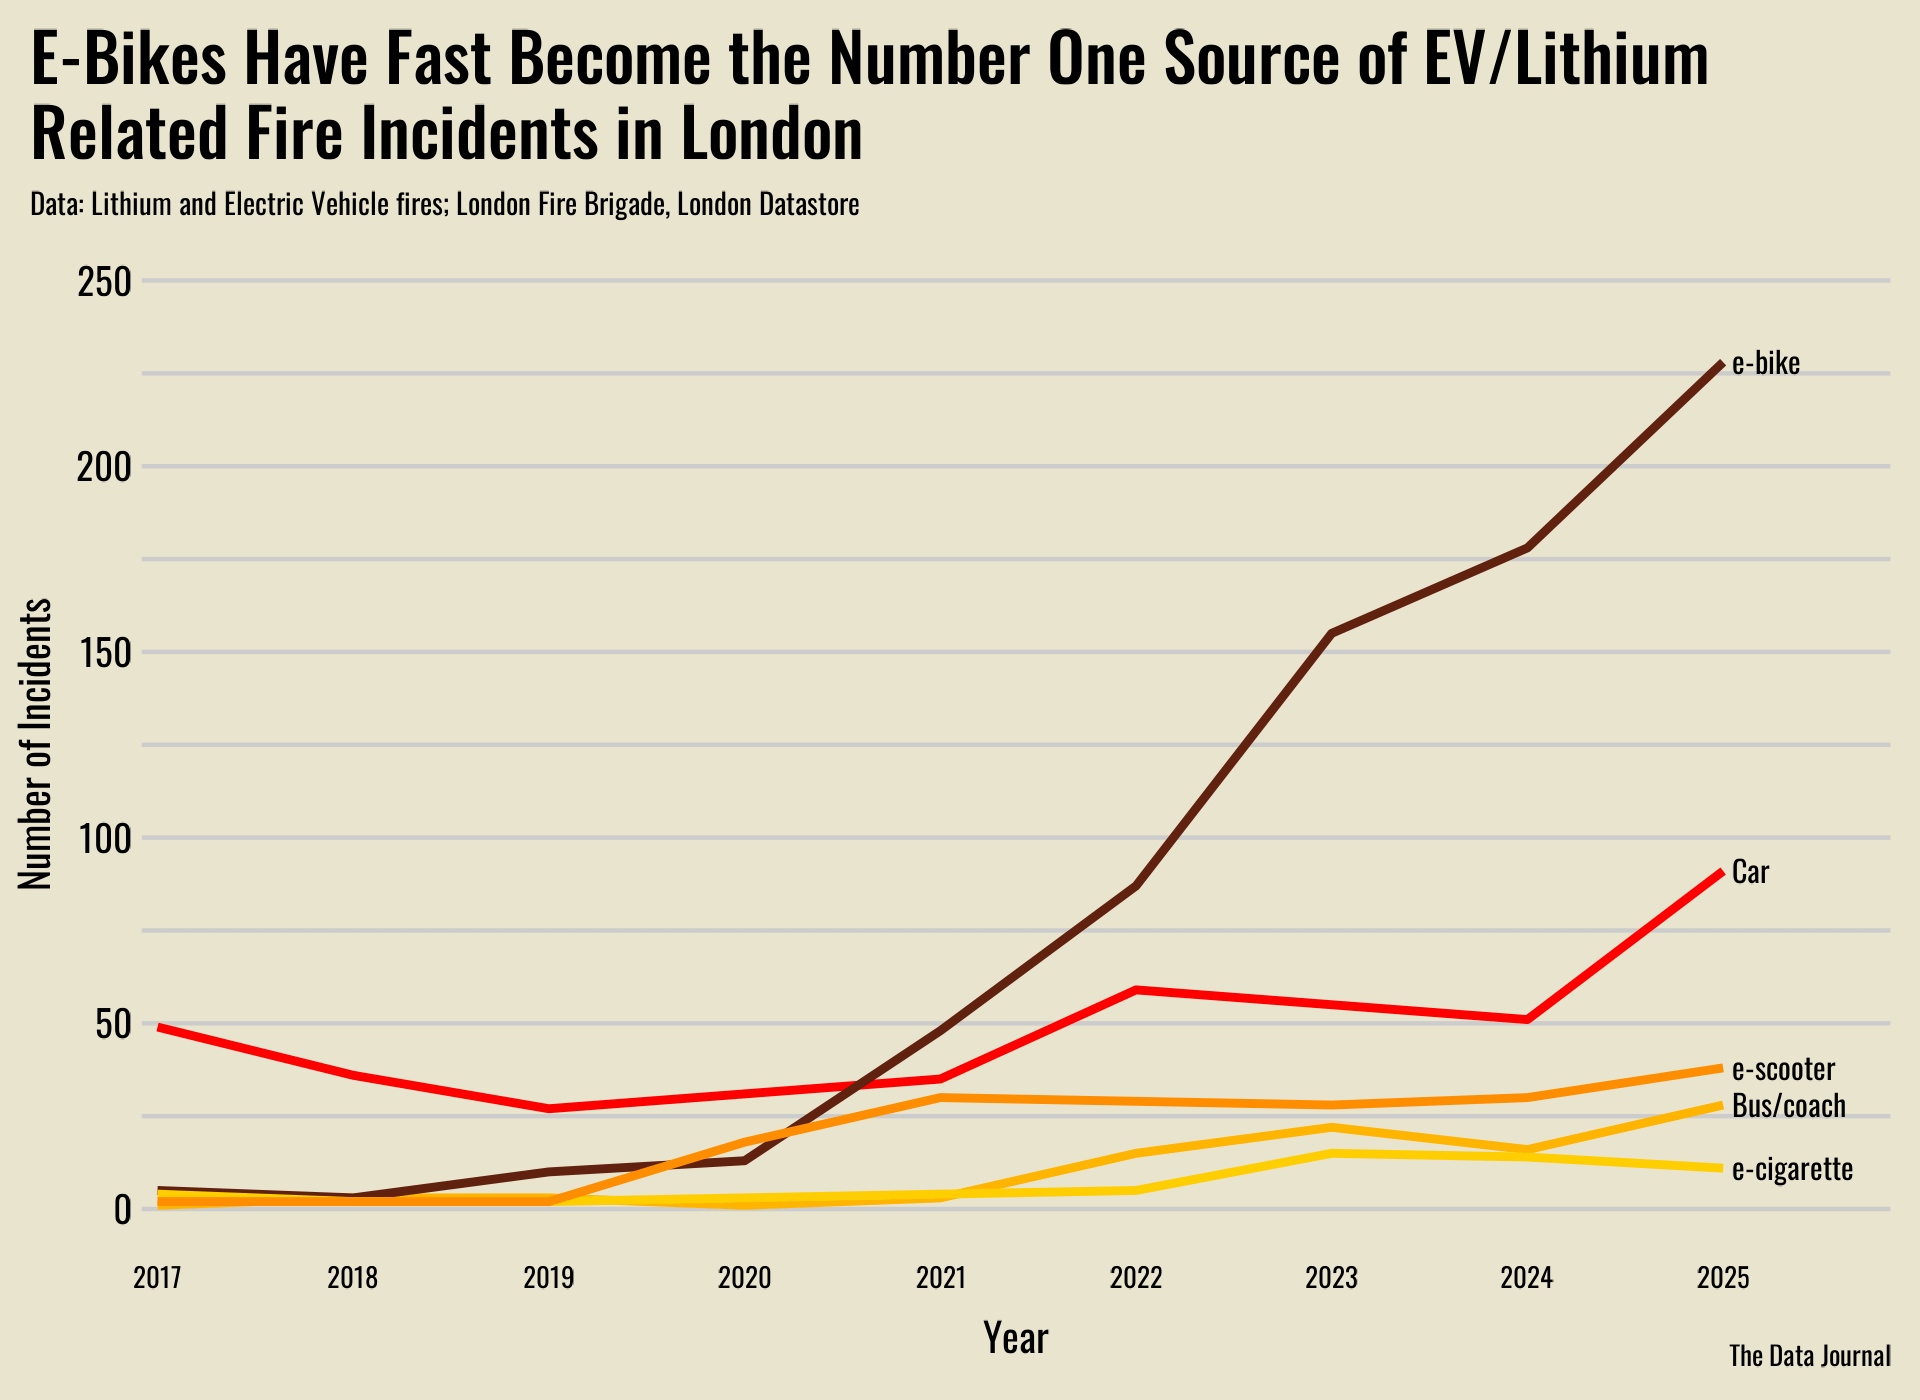
![[OC] e-bikes have significantly pulled ahead as the number one source for EV/Lithium related fires in London with more than 200 incidents in 2025.](https://www.byteseu.com/wp-content/uploads/2026/01/h1cl7i2deigg1-1536x1120.png "[OC] e-bikes have significantly pulled ahead as the number one source for EV/Lithium related fires in London with more than 200 incidents in 2025.")
11 Comments
I’d love to know the brand breakdown. There’s a lot of shitty e-bikes out there.
People riding these bikes as an alternative to owning a car – I think that’s great.
People riding these bikes and pretending they are exercising – they are a joke.
might be interesting to see percentages of fire accident in each of these disciplines instead of raw numbers.
I’m more concerned about what’s happening with the busses. I assume there are a couple hundred thousand ebikes in London, and only a couple thousand busses. And while there are plenty of cheapo dodgy e-bikes out there, I would expect busses to be somewhat higher grade and better maintained, and not 9 times more likely to catch fire than bikes, by ratio.
They don’t have scooters in London?
Kinda missing the graph comparing this with conventional car fires on a per-car basis. (And indeed other fire sources)
I love e-bikes, but we really gotta crack down on the dodgy imported conversion kits/batteries of dubious quality!
And install way more outside bike storage so they’re not catching fire in
This needs to be per vehicle to be if any use. The raw number doesn’t tell us the rate of problems these transport modes are having.
Still less bad than burning petrol
For me it is unclear what the data includes. In the source link from the other comment it states EV/ Li-Ion fires. But not every EV fire is a battery fire and gas cars also have li-Ion batteries that burn. So for me the included vehicles are unclear. Anyone got a methodology description? Judging by the amount of busses in London (which is 9000 and 2000EV according to other comments) 20 seems high. But it’s also 0 before 2019 so…
Could you make it so it’s relative to the numbers of bike/cars etc
Also a chart with 5 lines is not exactly beautiful data