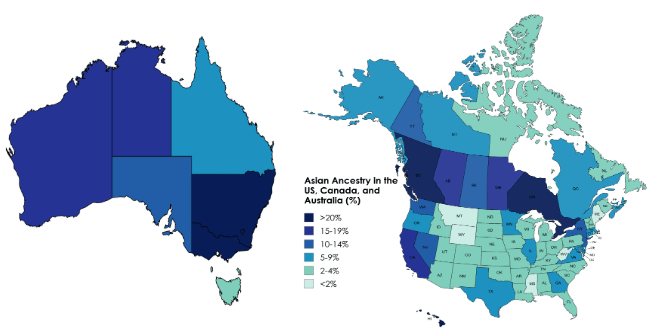
Immigration from the Asian continent to the US, Canada, and Australia has been occurring for over a century now but it has picked up substantially in the last 50 years. In the 21st century, immigrants from Asia account for approximately half of foreign-born residents in Australia and Canada, while in the US they account for around 25% of foreign-born residents, only trailing immigrants from Latin America who account for over half of the US’s foreign-born residents.
**US States with highest % of Asian ancestry:**
1. Hawaii (57%)
2. California (18%)
3. Washington (13%)
4. Nevada (12%)
5. New Jersey (11%)
**Canadian Provinces/Territories with highest % of Asian ancestry:**
1. British Columbia (31%)
2. Ontario (25%)
3. Alberta (19%)
4. Manitoba (16%)
5. Yukon (11%)
**Australian States/Territories with highest % of Asian ancestry:**
1. New South Wales (26%)
2. Australian Capital Territory (23%)
3. Victoria (22%)
4. Western Australia (17%)
5. Northern Territory (16%)
A11U45 on
Surprised at how low Queensland is.
str85 on
It’s usually a bit misleading, but don’t forget that middle eastern countries are also seen as Asian in statistics like there.

4 Comments
Need a scale going higher than 20%
[https://en.wikipedia.org/wiki/Asian_Americans#Demographics](https://en.wikipedia.org/wiki/Asian_Americans#Demographics) – 6% of the US population
[https://en.wikipedia.org/wiki/Asian_Canadians#Geographic_distribution](https://en.wikipedia.org/wiki/Asian_Canadians#Geographic_distribution) – 20% of the Canadian population
[https://en.wikipedia.org/wiki/Asian_Australians](https://en.wikipedia.org/wiki/Asian_Australians) – 18% of the Australian population
Immigration from the Asian continent to the US, Canada, and Australia has been occurring for over a century now but it has picked up substantially in the last 50 years. In the 21st century, immigrants from Asia account for approximately half of foreign-born residents in Australia and Canada, while in the US they account for around 25% of foreign-born residents, only trailing immigrants from Latin America who account for over half of the US’s foreign-born residents.
**US States with highest % of Asian ancestry:**
1. Hawaii (57%)
2. California (18%)
3. Washington (13%)
4. Nevada (12%)
5. New Jersey (11%)
**Canadian Provinces/Territories with highest % of Asian ancestry:**
1. British Columbia (31%)
2. Ontario (25%)
3. Alberta (19%)
4. Manitoba (16%)
5. Yukon (11%)
**Australian States/Territories with highest % of Asian ancestry:**
1. New South Wales (26%)
2. Australian Capital Territory (23%)
3. Victoria (22%)
4. Western Australia (17%)
5. Northern Territory (16%)
Surprised at how low Queensland is.
It’s usually a bit misleading, but don’t forget that middle eastern countries are also seen as Asian in statistics like there.