

Feb 7, 2026
IndexBox has just published a new report: EU – Electric Machines And Apparatus For Resistance Welding Of Metal – Market Analysis, Forecast, Size, Trends And Insights.
This article provides a comprehensive analysis of the European Union market for electric machines and apparatus for resistance welding of metal. It forecasts the market to grow at a CAGR of +0.6% in volume and +0.7% in value from 2024 to 2035, reaching 3.9 million units and $36.8 billion. The Netherlands dominates both consumption and production, accounting for approximately 91% of the market. While imports surged in volume in 2024, their value declined sharply due to a significant drop in average import prices. Conversely, export volumes grew, but the EU remains a net exporter in value terms, led by Germany and Italy.
Key Findings
- EU market forecast for slow but steady growth, with volume reaching 3.9M units and value $36.8B by 2035
- The Netherlands is the dominant market player, constituting about 91% of both consumption and production volume
- 2024 saw a sharp divergence in trade: import volume surged 35% while import value fell sharply due to a -40% price drop
- Export unit value is significantly higher than import unit value, indicating the EU exports higher-priced machines
- Germany and Italy are the leading exporters by value, while Greece recorded the fastest import volume growth
Market Forecast
Driven by increasing demand for electric machines and apparatus for resistance welding of metal in the European Union, the market is expected to continue an upward consumption trend over the next decade. Market performance is forecast to retain its current trend pattern, expanding with an anticipated CAGR of +0.6% for the period from 2024 to 2035, which is projected to bring the market volume to 3.9M units by the end of 2035.
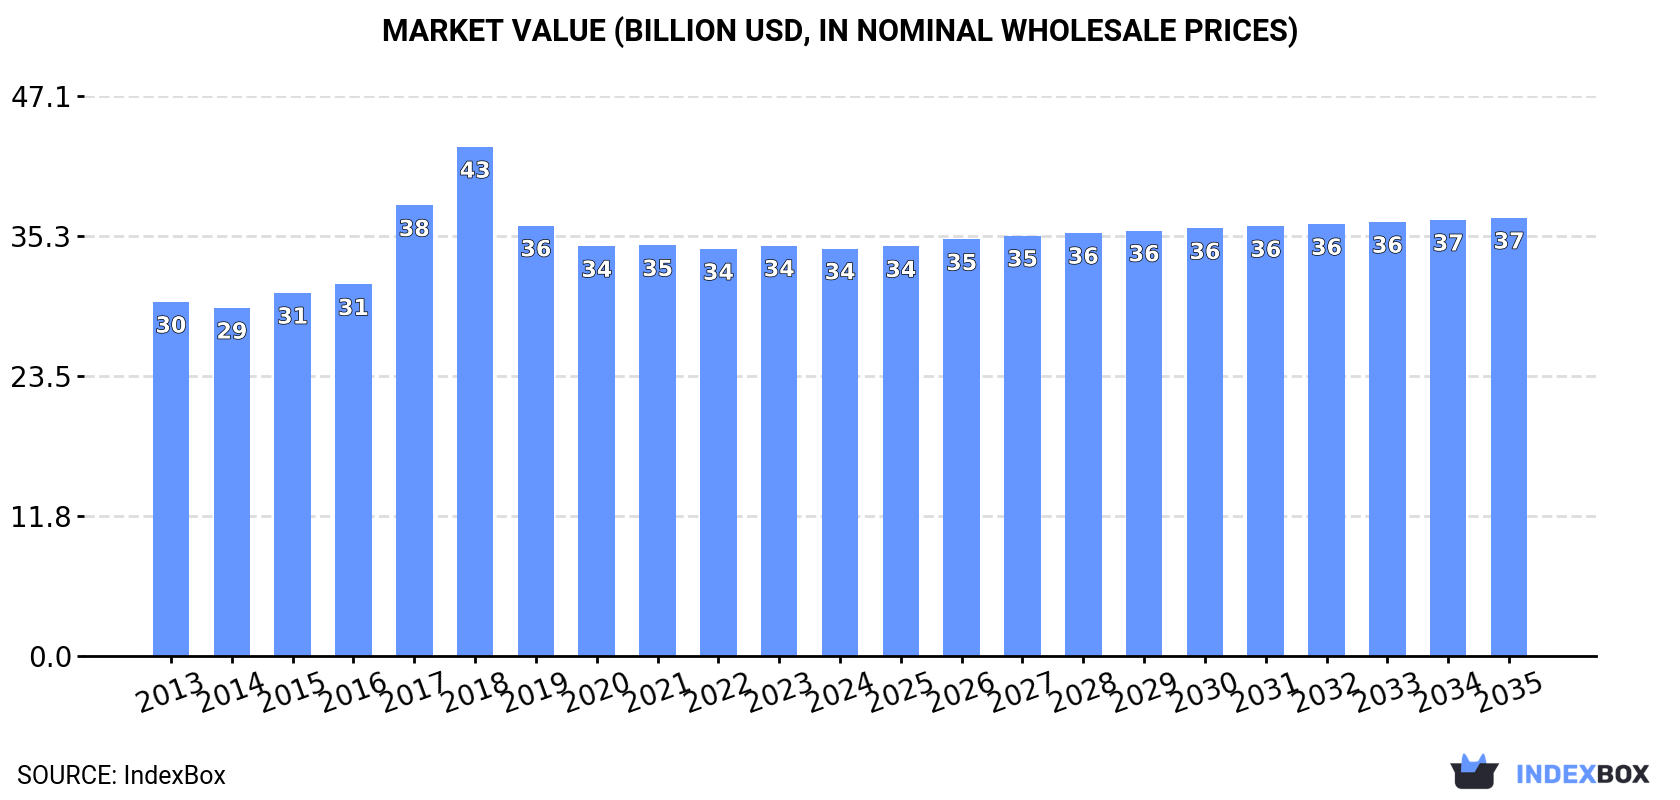
In value terms, the market is forecast to increase with an anticipated CAGR of +0.7% for the period from 2024 to 2035, which is projected to bring the market value to $36.8B (in nominal wholesale prices) by the end of 2035.
 ConsumptionEuropean Union’s Consumption of Electric Machines And Apparatus For Resistance Welding Of Metal
In 2024, consumption of electric machines and apparatus for resistance welding of metal was finally on the rise to reach 3.7M units for the first time since 2020, thus ending a three-year declining trend. The total consumption volume increased at an average annual rate of +1.2% over the period from 2013 to 2024; the trend pattern remained consistent, with somewhat noticeable fluctuations in certain years. The pace of growth was the most pronounced in 2020 when the consumption volume increased by 8.2% against the previous year. As a result, consumption attained the peak volume of 3.7M units; afterwards, it flattened through to 2024.
The revenue of the electric resistance welding machine market in the European Union fell slightly to $34.3B in 2024, approximately mirroring the previous year. This figure reflects the total revenues of producers and importers (excluding logistics costs, retail marketing costs, and retailers’ margins, which will be included in the final consumer price). The market value increased at an average annual rate of +1.3% from 2013 to 2024; the trend pattern indicated some noticeable fluctuations being recorded in certain years. The level of consumption peaked at $42.8B in 2018; however, from 2019 to 2024, consumption failed to regain momentum.
Consumption By Country
The Netherlands (3.3M units) constituted the country with the largest volume of electric resistance welding machine consumption, comprising approx. 91% of total volume. It was followed by Germany (87K units), with a 2.4% share of total consumption.
From 2013 to 2024, the average annual growth rate of volume in the Netherlands was relatively modest.
In value terms, the Netherlands ($31.4B) led the market, alone. The second position in the ranking was held by Germany ($911M).
In the Netherlands, the electric resistance welding machine market expanded at an average annual rate of +1.2% over the period from 2013-2024.
From 2013 to 2024, the average annual growth rate of the electric resistance welding machine per capita consumption in the Netherlands was relatively modest.
ProductionEuropean Union’s Production of Electric Machines And Apparatus For Resistance Welding Of Metal
In 2024, approx. 3.7M units of electric machines and apparatus for resistance welding of metal were produced in the European Union; remaining constant against 2023 figures. Overall, production, however, showed a relatively flat trend pattern. The most prominent rate of growth was recorded in 2020 when the production volume increased by 6.3%. Over the period under review, production reached the maximum volume at 3.9M units in 2014; however, from 2015 to 2024, production failed to regain momentum.
In value terms, electric resistance welding machine production reduced slightly to $34.6B in 2024 estimated in export price. In general, production, however, continues to indicate a relatively flat trend pattern. The most prominent rate of growth was recorded in 2017 when the production volume increased by 16% against the previous year. Over the period under review, production attained the maximum level at $46.1B in 2018; however, from 2019 to 2024, production failed to regain momentum.
Production By Country
The Netherlands (3.3M units) constituted the country with the largest volume of electric resistance welding machine production, comprising approx. 91% of total volume. It was followed by Germany (109K units), with a 3% share of total production. The third position in this ranking was held by Italy (74K units), with a 2% share.
From 2013 to 2024, the average annual rate of growth in terms of volume in the Netherlands was relatively modest. The remaining producing countries recorded the following average annual rates of production growth: Germany (-6.0% per year) and Italy (-4.0% per year).
ImportsEuropean Union’s Imports of Electric Machines And Apparatus For Resistance Welding Of Metal
In 2024, purchases abroad of electric machines and apparatus for resistance welding of metal increased by 35% to 134K units, rising for the second year in a row after two years of decline. Overall, imports posted a prominent expansion. The pace of growth was the most pronounced in 2020 when imports increased by 1,616%. Over the period under review, imports hit record highs in 2024 and are likely to see steady growth in the near future.
In value terms, electric resistance welding machine imports reduced sharply to $358M in 2024. In general, imports, however, recorded a pronounced contraction. The most prominent rate of growth was recorded in 2023 when imports increased by 54% against the previous year. The level of import peaked at $514M in 2019; however, from 2020 to 2024, imports stood at a somewhat lower figure.
Imports By Country
The purchases of the nine major importers of electric machines and apparatus for resistance welding of metal, namely Greece, Romania, Germany, Belgium, Poland, Spain, Italy, Slovenia and France, represented more than two-thirds of total import.
From 2013 to 2024, the biggest increases were recorded for Greece (with a CAGR of +89.1%), while purchases for the other leaders experienced more modest paces of growth.
In value terms, the largest electric resistance welding machine importing markets in the European Union were Germany ($68M), Poland ($38M) and Spain ($18M), together comprising 35% of total imports.
Poland, with a CAGR of +7.0%, recorded the highest growth rate of the value of imports, among the main importing countries over the period under review, while purchases for the other leaders experienced more modest paces of growth.
Import Prices By Country
In 2024, the import price in the European Union amounted to $2.7 thousand per unit, declining by -40.1% against the previous year. In general, the import price showed a deep downturn. The pace of growth appeared the most rapid in 2019 an increase of 188% against the previous year. As a result, import price attained the peak level of $69 thousand per unit. From 2020 to 2024, the import prices remained at a somewhat lower figure.
Prices varied noticeably by country of destination: amid the top importers, the country with the highest price was Poland ($4.3 thousand per unit), while Greece ($74 per unit) was amongst the lowest.
From 2013 to 2024, the most notable rate of growth in terms of prices was attained by Germany (+13.0%), while the other leaders experienced a decline in the import price figures.
ExportsEuropean Union’s Exports of Electric Machines And Apparatus For Resistance Welding Of Metal
Electric resistance welding machine exports surged to 137K units in 2024, rising by 23% on 2023 figures. Overall, exports, however, showed a abrupt shrinkage. The pace of growth appeared the most rapid in 2020 when exports increased by 83% against the previous year. The volume of export peaked at 799K units in 2014; however, from 2015 to 2024, the exports failed to regain momentum.
In value terms, electric resistance welding machine exports expanded slightly to $798M in 2024. In general, exports, however, continue to indicate a noticeable contraction. The most prominent rate of growth was recorded in 2017 with an increase of 17%. Over the period under review, the exports attained the peak figure at $1.2B in 2018; however, from 2019 to 2024, the exports stood at a somewhat lower figure.
Exports By Country
Germany (40K units) and Italy (36K units) represented the key exporters of electric machines and apparatus for resistance welding of metal in 2024, amounting to near 29% and 27% of total exports, respectively. Belgium (13K units) took a 9.4% share (based on physical terms) of total exports, which put it in second place, followed by France (9.4%) and the Netherlands (5.8%). The following exporters – Austria (5.6K units) and Sweden (4K units) – together made up 7% of total exports.
From 2013 to 2024, the biggest increases were recorded for Belgium (with a CAGR of +6.7%), while shipments for the other leaders experienced a decline in the exports figures.
In value terms, Germany ($277M), Italy ($214M) and the Netherlands ($89M) appeared to be the countries with the highest levels of exports in 2024, with a combined 73% share of total exports. France, Austria, Sweden and Belgium lagged somewhat behind, together accounting for a further 19%.
Among the main exporting countries, France, with a CAGR of +6.0%, saw the highest growth rate of the value of exports, over the period under review, while shipments for the other leaders experienced mixed trends in the exports figures.
Export Prices By Country
The export price in the European Union stood at $5.8 thousand per unit in 2024, shrinking by -15.5% against the previous year. In general, the export price, however, posted a remarkable increase. The pace of growth was the most pronounced in 2017 when the export price increased by 494% against the previous year. Over the period under review, the export prices reached the peak figure at $16 thousand per unit in 2018; however, from 2019 to 2024, the export prices failed to regain momentum.
There were significant differences in the average prices amongst the major exporting countries. In 2024, amid the top suppliers, the country with the highest price was the Netherlands ($11 thousand per unit), while Belgium ($826 per unit) was amongst the lowest.
From 2013 to 2024, the most notable rate of growth in terms of prices was attained by the Netherlands (+38.3%), while the other leaders experienced more modest paces of growth.
This report provides a comprehensive view of the electric resistance welding machine industry in European Union, tracking demand, supply, and trade flows across the regional value chain. It explains how demand across key channels and end-use segments shapes consumption patterns, while also mapping the role of input availability, production efficiency, and regulatory standards on supply.
Beyond headline metrics, the study benchmarks prices, margins, and trade routes so you can see where value is created and how it moves between exporters and importers within European Union. The analysis is designed to support strategic planning, market entry, portfolio prioritization, and risk management in the electric resistance welding machine landscape in European Union.
Quick navigation
Key findings
- Regional demand is shaped by both household and industrial usage, with trade flows linking supply hubs to import-reliant countries.
- Pricing dynamics reflect unit values, freight costs, exchange rates, and regulatory shifts that affect sourcing decisions.
- Supply depends on input availability and production efficiency, creating distinct cost curves across European Union.
- Market concentration varies by country, creating different competitive landscapes and entry barriers.
- The 2035 outlook highlights where capacity investment and demand growth are most aligned within the region.
Report scope
The report combines market sizing with trade intelligence and price analytics for European Union. It covers both historical performance and the forward outlook to 2035, allowing you to compare cycles, structural shifts, and policy impacts across countries and sub-regions.
- Market size and growth in value and volume terms
- Consumption structure by end-use segments and countries
- Production capacity, output, and cost dynamics
- Regional trade flows, exporters, importers, and balances
- Price benchmarks, unit values, and margin signals
- Competitive context and market entry conditions
Product coverage
- electric machines and apparatus for resistance welding of metal.
Country coverage
- Austria, Belgium, Bulgaria, Croatia, Cyprus, Czech Republic, Denmark, Estonia, Finland, France, Germany, Greece, Hungary, Ireland, Italy, Latvia, Lithuania, Luxembourg, Malta, Netherlands, Poland, Portugal, Romania , Slovakia, Slovenia, Spain, Sweden, United Kingdom.
Country profiles and benchmarks
For the regional report, country profiles provide a consistent view of market size, trade balance, prices, and per-capita indicators across European Union. The profiles highlight the largest consuming and producing markets and allow direct benchmarking across peers.
Methodology
The analysis is built on a multi-source framework that combines official statistics, trade records, company disclosures, and expert validation. Data are standardized, reconciled, and cross-checked to ensure consistency across time series.
- International trade data (exports, imports, and mirror statistics)
- National production and consumption statistics
- Company-level information from financial filings and public releases
- Price series and unit value benchmarks
- Analyst review, outlier checks, and time-series validation
All data are normalized to a common product definition and mapped to a consistent set of codes. This ensures that comparisons across time are aligned and actionable.
Forecasts to 2035
The forecast horizon extends to 2035 and is based on a structured model that links electric resistance welding machine demand and supply to macroeconomic indicators, trade patterns, and sector-specific drivers. The model captures both cyclical and structural factors and reflects known policy and technology shifts within European Union.
- Historical baseline: 2012-2025
- Forecast horizon: 2026-2035
- Scenario-based sensitivity to income growth, substitution, and regulation
- Capacity and investment outlook for major producing countries
Each country projection is built from its own historical pattern and the regional context, allowing the report to show where growth is concentrated and where risks are elevated.
Price analysis and trade dynamics
Prices are analyzed in detail, including export and import unit values, regional spreads, and changes in trade costs. The report highlights how seasonality, freight rates, exchange rates, and supply disruptions influence pricing and margins.
- Price benchmarks by country and sub-region
- Export and import unit value trends
- Seasonality and calendar effects in trade flows
- Price outlook to 2035 under baseline assumptions
Profiles of market participants
Key producers, exporters, and distributors are profiled with a focus on their operational scale, geographic footprint, product mix, and market positioning. This helps identify competitive pressure points, partnership opportunities, and routes to differentiation.
- Business focus and production capabilities
- Geographic reach and distribution networks
- Cost structure and pricing strategy indicators
- Compliance, certification, and sustainability context
How to use this report
- Quantify regional demand and identify the most attractive country markets
- Evaluate export opportunities and prioritize target destinations
- Track price dynamics and protect margins
- Benchmark performance against regional competitors
- Build evidence-based forecasts for investment decisions
This report is designed for manufacturers, distributors, importers, wholesalers, investors, and advisors who need a clear, data-driven picture of electric resistance welding machine dynamics in European Union.
FAQ
What is included in the electric resistance welding machine market in European Union?
The market size aggregates consumption and trade data at country and sub-regional levels, presented in both value and volume terms.
How are the forecasts to 2035 built?
The projections combine historical trends with macroeconomic indicators, trade dynamics, and sector-specific drivers.
Does the report cover prices and margins?
Yes, it includes export and import unit values, regional spreads, and a pricing outlook to 2035.
Which countries are profiled in detail?
The report provides profiles for the largest consuming and producing countries in European Union.
Can this report support market entry decisions?
Yes, it highlights demand hotspots, trade routes, pricing trends, and competitive context.